| Param | Original file | Final file |
|---|---|---|
| Filename | modeM0/AS1A06_006T01_9000002724cztM0_level2_bc.evt | modeM0/AS1A06_006T01_9000002724cztM0_level2_quad_clean.evt |
| Size (bytes) | 3,893,431,680 | 1,314,910,080 |
| Size | 3.6 GB | 1.2 GB |
| Events in quadrant A | 22,577,535 | 8,301,183 |
| Events in quadrant B | 25,459,455 | 8,371,272 |
| Events in quadrant C | 25,282,175 | 8,159,628 |
| Events in quadrant D | 37,523,529 | 7,880,174 |
| Mode M0 | |||
|---|---|---|---|
| Quadrant | BADHDUFLAG | Total packets | Discarded packets |
| A | 0 | 218346 | 0 |
| B | 0 | 227902 | 0 |
| C | 0 | 229553 | 0 |
| D | 0 | 266136 | 0 |
| Mode SS | |||
|---|---|---|---|
| Quadrant | BADHDUFLAG | Total packets | Discarded packets |
| A | 0 | 2108 | 0 |
| B | 0 | 2108 | 0 |
| C | 0 | 2108 | 0 |
| D | 0 | 2108 | 0 |
| Mode M9 | |||
|---|---|---|---|
| Quadrant | BADHDUFLAG | Total packets | Discarded packets |
| A | 0 | 169 | 0 |
| B | 0 | 169 | 0 |
| C | 0 | 169 | 0 |
| D | 0 | 169 | 0 |
| Quadrant | Total seconds | Saturated seconds | Saturation percentage |
|---|---|---|---|
| A | 103853 | 1478 | 1.423165% |
| B | 103853 | 2020 | 1.945057% |
| C | 103853 | 2666 | 2.567090% |
| D | 103853 | 4233 | 4.075954% |
Noise dominated data is calculated using 1-second bins in cleaned event files. If a bin has >2000 counts, and if more than 50% of those come from <1% of pixels, then it is considered to be noise-dominated and hence unusable.
| Quadrant | # 1 sec bins | Bins with >0 counts | Bins with >2000 counts | High rate bins dominated by noise | Noise dominated (total time) | Noise dominated (detector-on time) | Marked lightcurve |
|---|---|---|---|---|---|---|---|
| A | 120283 | 103856 | 40 | 40 | 0.03% | 0.04% |  |
| B | 120283 | 103853 | 58 | 58 | 0.05% | 0.06% |  |
| C | 120283 | 103855 | 213 | 213 | 0.18% | 0.21% | 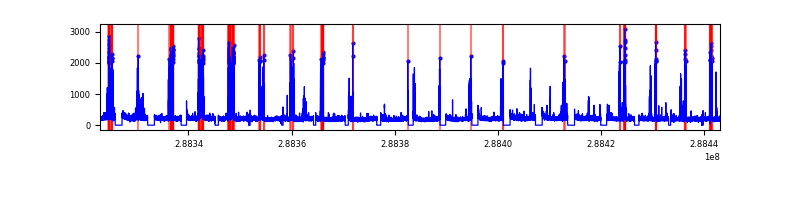 |
| D | 120283 | 103855 | 1090 | 1090 | 0.91% | 1.05% |  |
Top three noisy pixels from each quadrant. If the there are fewer than three noisy pixels in the level2.evt file, extra rows are filled as -1
| Pixel properties | Quadrant properties | ||||||
|---|---|---|---|---|---|---|---|
| Quadrant | DetID | PixID | Counts | Sigma | Mean | Median | Sigma |
| A | 15 | 174 | 787811 | 657.04 | 5502 | 5402 | 1190.8 |
| A | 4 | 2 | 420752 | 348.79 | 5502 | 5402 | 1190.8 |
| A | 8 | 34 | 107275 | 85.55 | 5502 | 5402 | 1190.8 |
| B | 10 | 245 | 1087006 | 1035.96 | 5571 | 5431 | 1044.0 |
| B | 3 | 64 | 1067801 | 1017.57 | 5571 | 5431 | 1044.0 |
| B | 0 | 189 | 352799 | 332.72 | 5571 | 5431 | 1044.0 |
| C | 0 | 207 | 3570443 | 2865.88 | 5344 | 5325 | 1244.0 |
| C | 3 | 233 | 1084605 | 867.6 | 5344 | 5325 | 1244.0 |
| C | 8 | 128 | 55957 | 40.7 | 5344 | 5325 | 1244.0 |
| D | 1 | 52 | 9749269 | 7811.22 | 5398 | 5207 | 1247.4 |
| D | 7 | 238 | 2567134 | 2053.74 | 5398 | 5207 | 1247.4 |
| D | 14 | 34 | 777521 | 619.12 | 5398 | 5207 | 1247.4 |
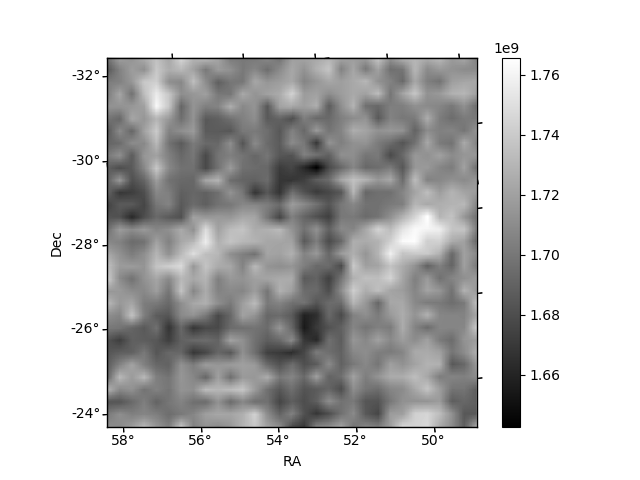
Histogram calculated using DETX and DETY for each event in the final _common_clean file
| Quadrant A |  |
 |
Quadrant B |
|---|---|---|---|
| Quadrant D | 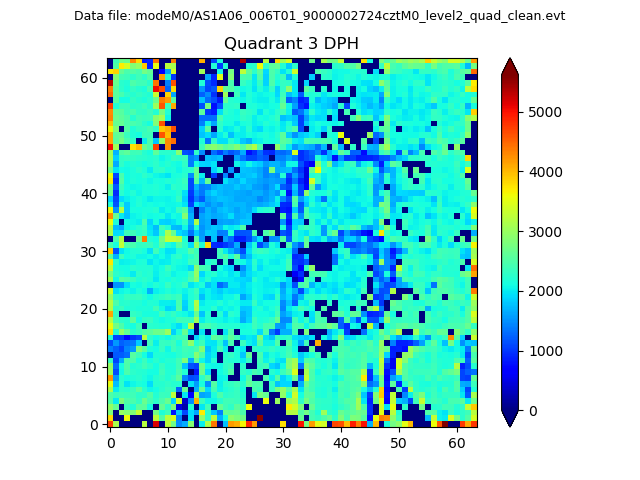 |
 |
Quadrant C |
| Plot type | Count rate plots | Images |
|---|---|---|
| Comparison with Poisson distribution Blue bars denote a histogram of data divided into 1 sec bins. Red curve is a Poisson curve with rate = median count rate of data. |
 |
 |
| Quadrant-wise count rates Data is divided into 100 sec bins |
 |
|
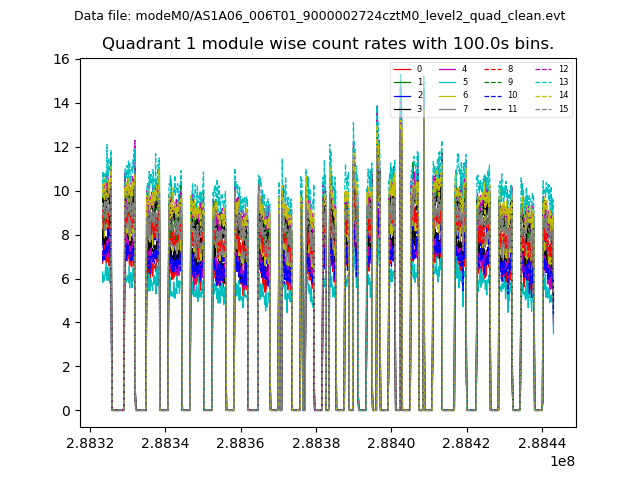
| Module-wise count rates for Quadrant A Data is divided into 100 sec bins |
 |
 |
| Module-wise count rates for Quadrant B Data is divided into 100 sec bins |
 |
 |
| Module-wise count rates for Quadrant C Data is divided into 100 sec bins |
 |
 |
| Module-wise count rates for Quadrant D Data is divided into 100 sec bins |
 |
 |
| Parameter | Plot |
|---|---|
| CZT HV Monitor | 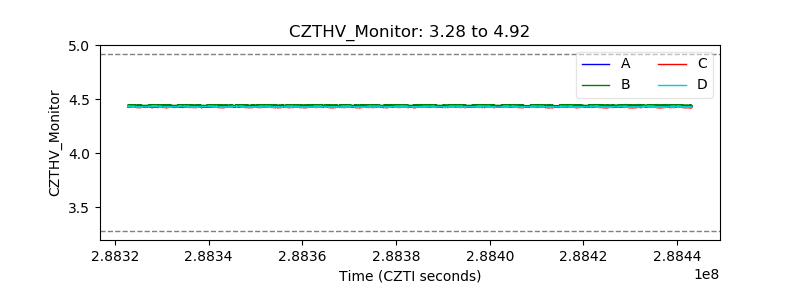 |
| D_VDD |  |
| Temperature 1 | 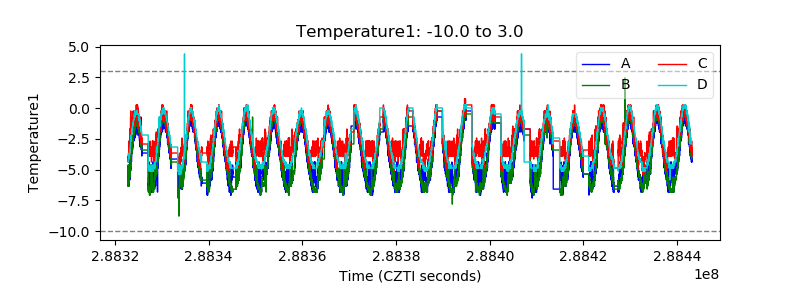 |
| Veto HV Monitor |  |
| Veto LLD |  |
| Alpha Counter |  |
| _CPM_Rate | 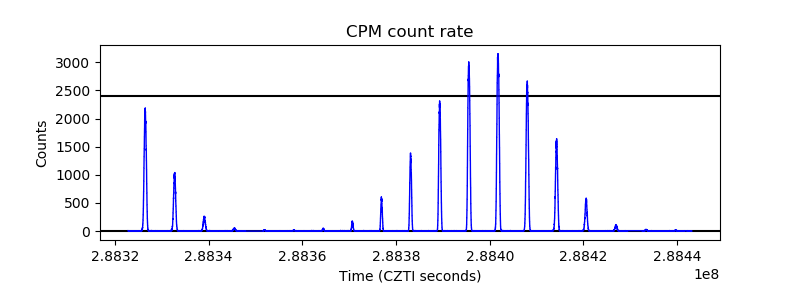 |
| CZT Counter |  |
| +2.5 Volts monitor |  |
| +5 Volts monitor |  |
| _ROLL_ROT | 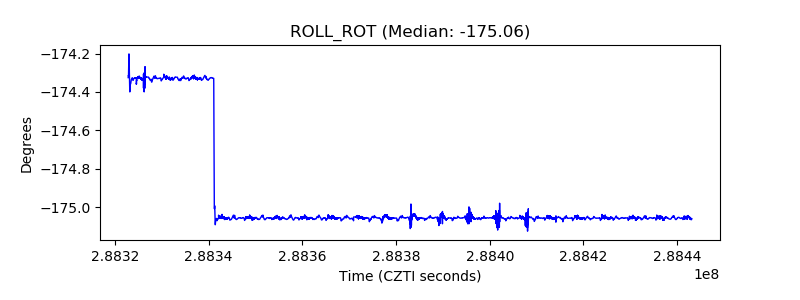 |
| _Roll_DEC |  |
| _Roll_RA |  |
| Veto Counter | 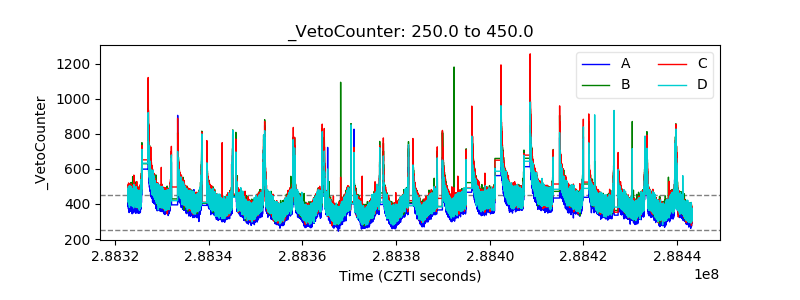 |