| Param | Original file | Final file |
|---|---|---|
| Filename | modeM0/AS1A06_006T01_9000002720cztM0_level2_bc.evt | modeM0/AS1A06_006T01_9000002720cztM0_level2_quad_clean.evt |
| Size (bytes) | 20,263,798,080 | 6,062,555,520 |
| Size | 18.9 GB | 5.6 GB |
| Events in quadrant A | 105,846,114 | 38,568,159 |
| Events in quadrant B | 114,222,460 | 38,751,859 |
| Events in quadrant C | 105,641,555 | 37,846,235 |
| Events in quadrant D | 255,083,565 | 35,326,879 |
| Mode SS | |||
|---|---|---|---|
| Quadrant | BADHDUFLAG | Total packets | Discarded packets |
| A | 0 | 9862 | 0 |
| B | 0 | 9862 | 0 |
| C | 0 | 9862 | 0 |
| D | 0 | 9862 | 0 |
| Mode M9 | |||
|---|---|---|---|
| Quadrant | BADHDUFLAG | Total packets | Discarded packets |
| A | 0 | 769 | 0 |
| B | 0 | 769 | 0 |
| C | 0 | 769 | 0 |
| D | 0 | 769 | 0 |
| Mode M0 | |||
|---|---|---|---|
| Quadrant | BADHDUFLAG | Total packets | Discarded packets |
| A | 0 | 1020840 | 0 |
| B | 0 | 1055504 | 0 |
| C | 0 | 1032663 | 0 |
| D | 0 | 1527541 | 0 |
| Quadrant | Total seconds | Saturated seconds | Saturation percentage |
|---|---|---|---|
| A | 483893 | 6505 | 1.344305% |
| B | 483893 | 7694 | 1.590021% |
| C | 483892 | 8655 | 1.788622% |
| D | 483892 | 39531 | 8.169385% |
Noise dominated data is calculated using 1-second bins in cleaned event files. If a bin has >2000 counts, and if more than 50% of those come from <1% of pixels, then it is considered to be noise-dominated and hence unusable.
| Quadrant | # 1 sec bins | Bins with >0 counts | Bins with >2000 counts | High rate bins dominated by noise | Noise dominated (total time) | Noise dominated (detector-on time) | Marked lightcurve |
|---|---|---|---|---|---|---|---|
| A | 560544 | 483913 | 319 | 319 | 0.06% | 0.07% |  |
| B | 560544 | 483896 | 91 | 91 | 0.02% | 0.02% | 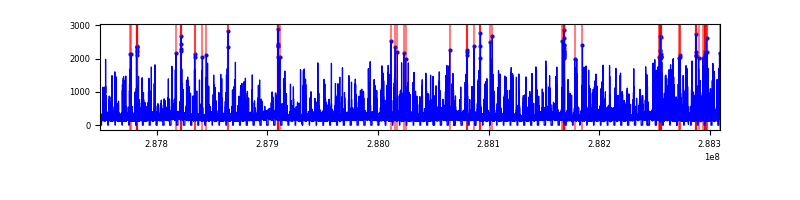 |
| C | 560544 | 483909 | 179 | 179 | 0.03% | 0.04% | 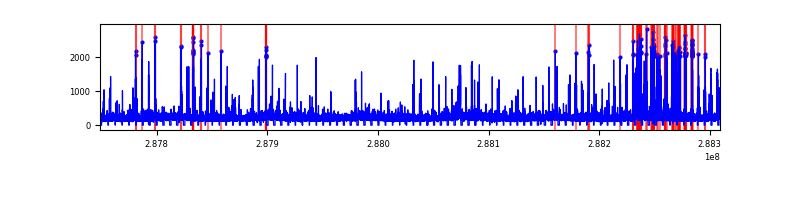 |
| D | 560544 | 483894 | 9165 | 9165 | 1.64% | 1.89% |  |
Top three noisy pixels from each quadrant. If the there are fewer than three noisy pixels in the level2.evt file, extra rows are filled as -1
| Pixel properties | Quadrant properties | ||||||
|---|---|---|---|---|---|---|---|
| Quadrant | DetID | PixID | Counts | Sigma | Mean | Median | Sigma |
| A | 15 | 174 | 4697933 | 831.31 | 25820 | 25329 | 5620.7 |
| A | 4 | 2 | 1130334 | 196.59 | 25820 | 25329 | 5620.7 |
| A | 9 | 143 | 664290 | 113.68 | 25820 | 25329 | 5620.7 |
| B | 7 | 220 | 4792362 | 985.52 | 26037 | 25412 | 4837.0 |
| B | 3 | 64 | 1321654 | 267.98 | 26037 | 25412 | 4837.0 |
| B | 0 | 190 | 1318271 | 267.29 | 26037 | 25412 | 4837.0 |
| C | 3 | 233 | 3688388 | 629.57 | 24971 | 24875 | 5819.1 |
| C | 0 | 207 | 2958411 | 504.12 | 24971 | 24875 | 5819.1 |
| C | 4 | 254 | 2833937 | 482.73 | 24971 | 24875 | 5819.1 |
| D | 7 | 238 | 76063564 | 13203.34 | 24766 | 23903 | 5759.1 |
| D | 1 | 52 | 40518190 | 7031.33 | 24766 | 23903 | 5759.1 |
| D | 13 | 168 | 24088741 | 4178.56 | 24766 | 23903 | 5759.1 |
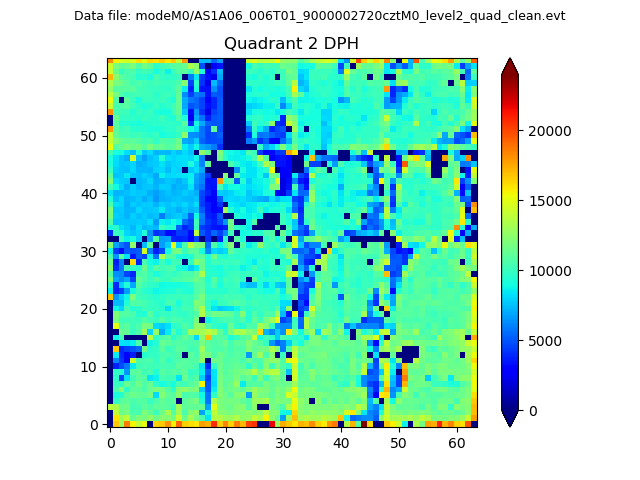
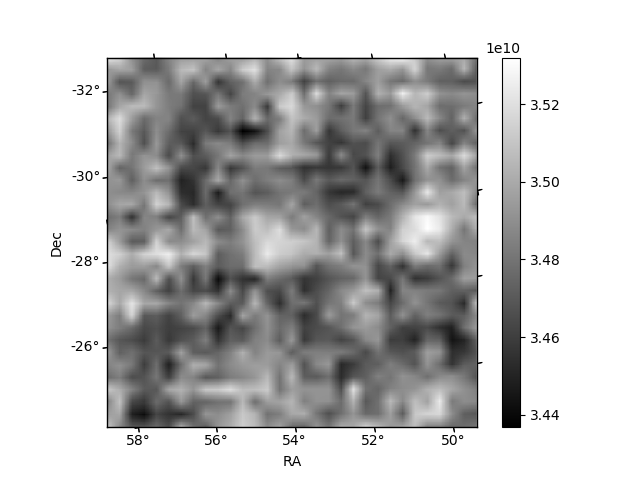
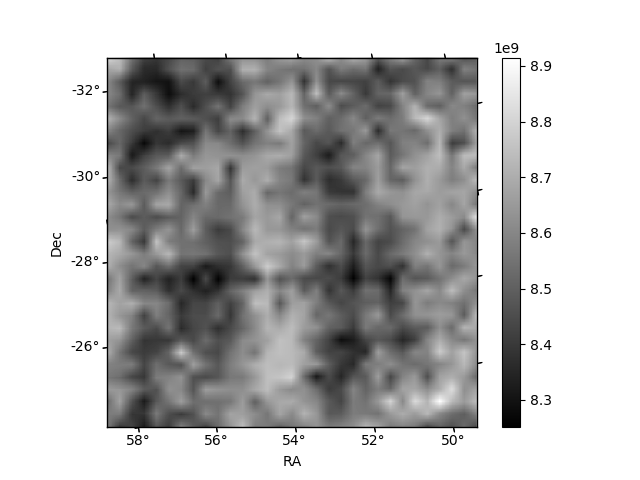
Histogram calculated using DETX and DETY for each event in the final _common_clean file
| Quadrant A |  |
 |
Quadrant B |
|---|---|---|---|
| Quadrant D | 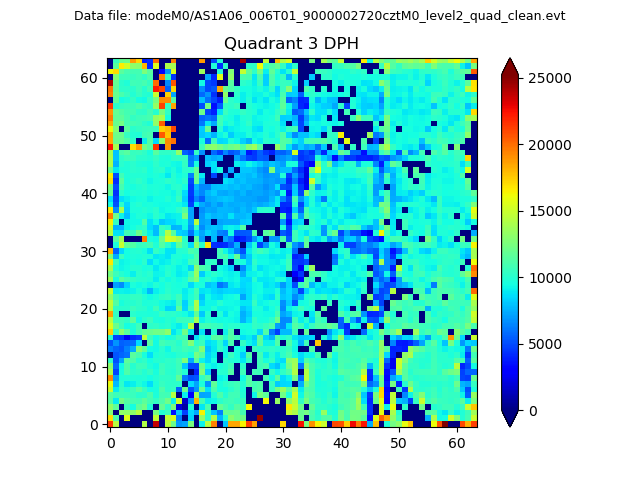 |
 |
Quadrant C |
| Plot type | Count rate plots | Images |
|---|---|---|
| Comparison with Poisson distribution Blue bars denote a histogram of data divided into 1 sec bins. Red curve is a Poisson curve with rate = median count rate of data. |
 |
 |
| Quadrant-wise count rates Data is divided into 100 sec bins |
 |
|
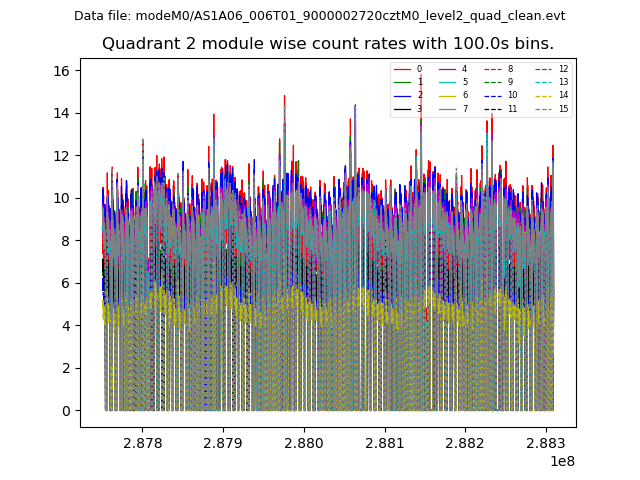
| Module-wise count rates for Quadrant A Data is divided into 100 sec bins |
 |
 |
| Module-wise count rates for Quadrant B Data is divided into 100 sec bins |
 |
 |
| Module-wise count rates for Quadrant C Data is divided into 100 sec bins |
 |
 |
| Module-wise count rates for Quadrant D Data is divided into 100 sec bins |
 |
 |
| Parameter | Plot |
|---|---|
| CZT HV Monitor |  |
| D_VDD | 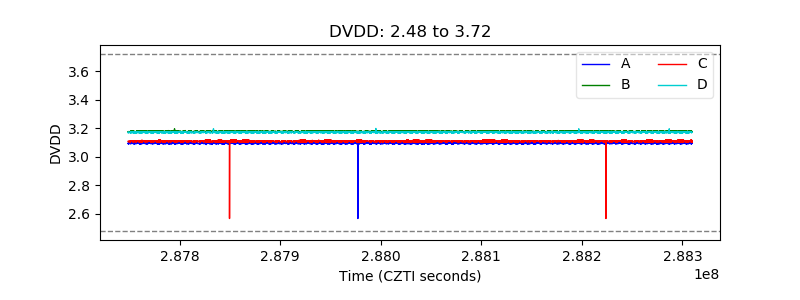 |
| Temperature 1 |  |
| Veto HV Monitor |  |
| Veto LLD |  |
| Alpha Counter |  |
| _CPM_Rate |  |
| CZT Counter | 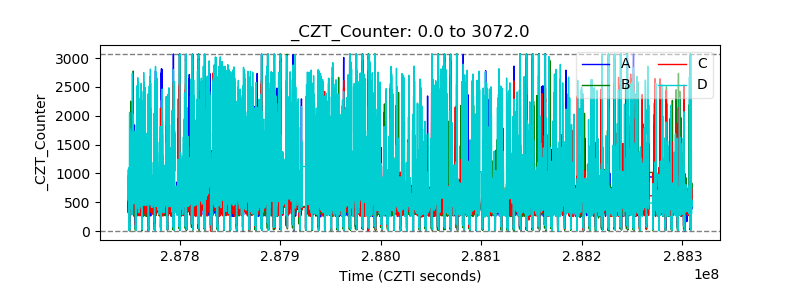 |
| +2.5 Volts monitor | 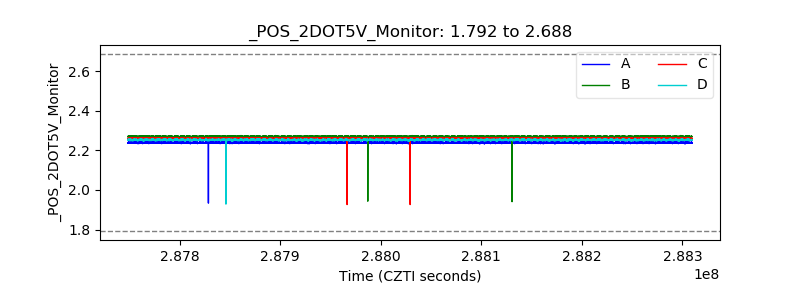 |
| +5 Volts monitor |  |
| _ROLL_ROT | 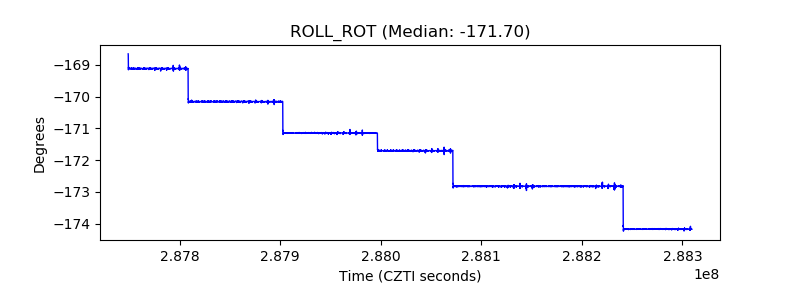 |
| _Roll_DEC |  |
| _Roll_RA |  |
| Veto Counter |  |