| Param | Original file | Final file |
|---|---|---|
| Filename | modeM0/AS1A05_019T01_9000002718cztM0_level2_bc.evt | modeM0/AS1A05_019T01_9000002718cztM0_level2_quad_clean.evt |
| Size (bytes) | 5,573,589,120 | 2,135,390,400 |
| Size | 5.2 GB | 2.0 GB |
| Events in quadrant A | 36,994,096 | 13,823,322 |
| Events in quadrant B | 35,337,479 | 13,985,570 |
| Events in quadrant C | 32,075,690 | 13,149,424 |
| Events in quadrant D | 53,567,100 | 12,835,302 |
| Mode M9 | |||
|---|---|---|---|
| Quadrant | BADHDUFLAG | Total packets | Discarded packets |
| A | 0 | 259 | 0 |
| B | 0 | 259 | 0 |
| C | 0 | 259 | 0 |
| D | 0 | 259 | 0 |
| Mode M0 | |||
|---|---|---|---|
| Quadrant | BADHDUFLAG | Total packets | Discarded packets |
| A | 0 | 344505 | 0 |
| B | 0 | 338066 | 0 |
| C | 0 | 330923 | 0 |
| D | 0 | 397671 | 0 |
| Mode SS | |||
|---|---|---|---|
| Quadrant | BADHDUFLAG | Total packets | Discarded packets |
| A | 0 | 3238 | 0 |
| B | 0 | 3238 | 0 |
| C | 0 | 3238 | 0 |
| D | 0 | 3238 | 0 |
| Quadrant | Total seconds | Saturated seconds | Saturation percentage |
|---|---|---|---|
| A | 158925 | 2639 | 1.660532% |
| B | 158925 | 2335 | 1.469246% |
| C | 158925 | 2314 | 1.456033% |
| D | 158925 | 5137 | 3.232342% |
Noise dominated data is calculated using 1-second bins in cleaned event files. If a bin has >2000 counts, and if more than 50% of those come from <1% of pixels, then it is considered to be noise-dominated and hence unusable.
| Quadrant | # 1 sec bins | Bins with >0 counts | Bins with >2000 counts | High rate bins dominated by noise | Noise dominated (total time) | Noise dominated (detector-on time) | Marked lightcurve |
|---|---|---|---|---|---|---|---|
| A | 184840 | 158933 | 46 | 46 | 0.02% | 0.03% |  |
| B | 184840 | 158928 | 10 | 10 | 0.01% | 0.01% |  |
| C | 184840 | 158931 | 9 | 9 | 0.00% | 0.01% |  |
| D | 184840 | 158930 | 767 | 767 | 0.41% | 0.48% |  |
Top three noisy pixels from each quadrant. If the there are fewer than three noisy pixels in the level2.evt file, extra rows are filled as -1
| Pixel properties | Quadrant properties | ||||||
|---|---|---|---|---|---|---|---|
| Quadrant | DetID | PixID | Counts | Sigma | Mean | Median | Sigma |
| A | 15 | 174 | 3142955 | 1702.72 | 8566 | 8423 | 1840.9 |
| A | 4 | 2 | 544048 | 290.96 | 8566 | 8423 | 1840.9 |
| A | 8 | 255 | 251275 | 131.92 | 8566 | 8423 | 1840.9 |
| B | 7 | 220 | 956872 | 581.43 | 8636 | 8413 | 1631.3 |
| B | 0 | 189 | 215244 | 126.79 | 8636 | 8413 | 1631.3 |
| B | 4 | 216 | 207966 | 122.33 | 8636 | 8413 | 1631.3 |
| C | 0 | 207 | 414779 | 214.77 | 8129 | 8087 | 1893.6 |
| C | 3 | 233 | 298019 | 153.11 | 8129 | 8087 | 1893.6 |
| C | 4 | 223 | 67336 | 31.29 | 8129 | 8087 | 1893.6 |
| D | 1 | 52 | 10365820 | 5399.65 | 8313 | 8019 | 1918.2 |
| D | 7 | 238 | 8423316 | 4387.0 | 8313 | 8019 | 1918.2 |
| D | 13 | 168 | 864697 | 446.6 | 8313 | 8019 | 1918.2 |
Histogram calculated using DETX and DETY for each event in the final _common_clean file
| Quadrant A |  |
 |
Quadrant B |
|---|---|---|---|
| Quadrant D |  |
 |
Quadrant C |
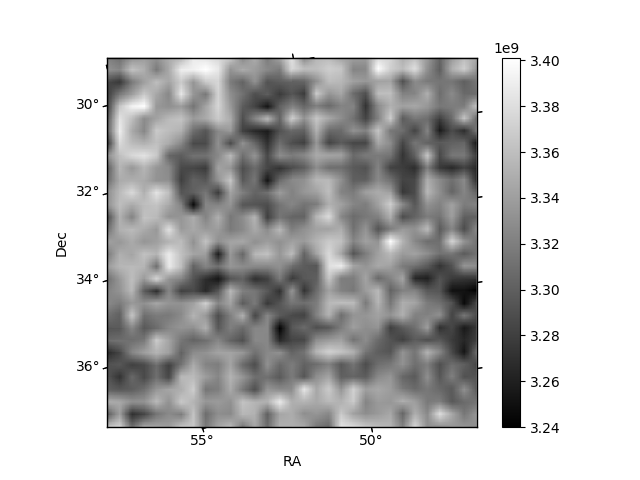
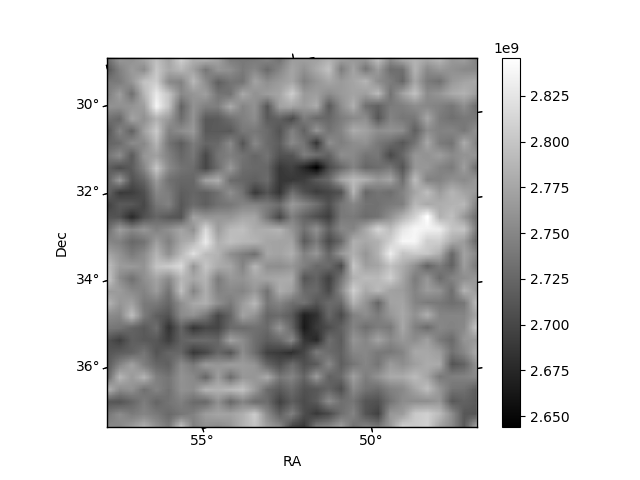
| Plot type | Count rate plots | Images |
|---|---|---|
| Comparison with Poisson distribution Blue bars denote a histogram of data divided into 1 sec bins. Red curve is a Poisson curve with rate = median count rate of data. |
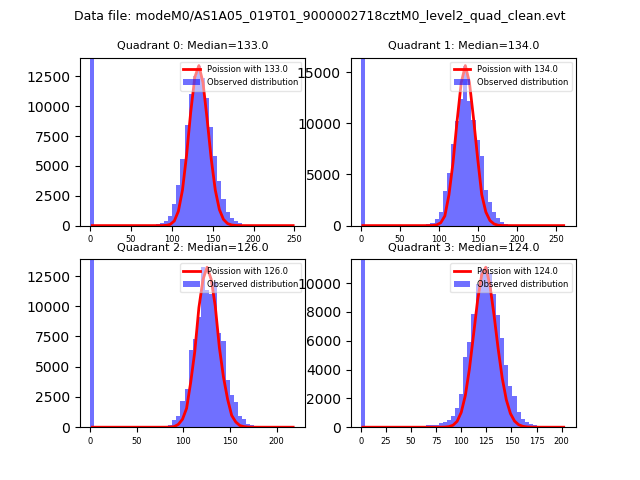 |
 |
| Quadrant-wise count rates Data is divided into 100 sec bins |
 |
|
| Module-wise count rates for Quadrant A Data is divided into 100 sec bins |
 |
 |
| Module-wise count rates for Quadrant B Data is divided into 100 sec bins |
 |
 |
| Module-wise count rates for Quadrant C Data is divided into 100 sec bins |
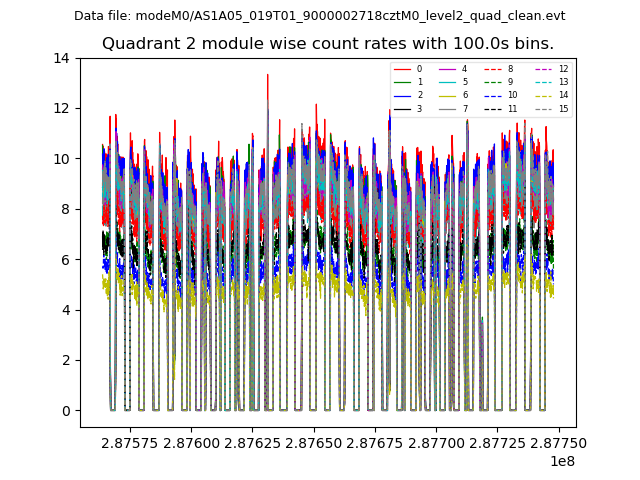 |
 |
| Module-wise count rates for Quadrant D Data is divided into 100 sec bins |
 |
 |
| Parameter | Plot |
|---|---|
| CZT HV Monitor |  |
| D_VDD |  |
| Temperature 1 |  |
| Veto HV Monitor |  |
| Veto LLD |  |
| Alpha Counter | 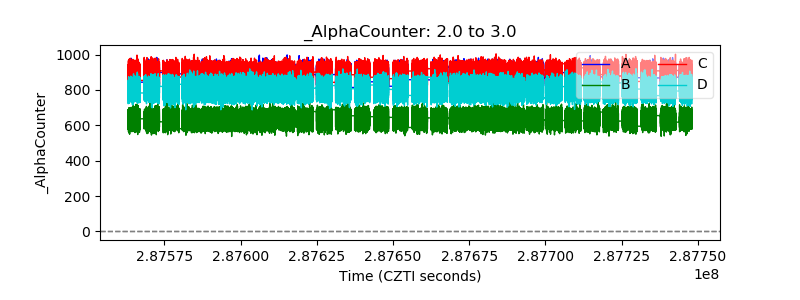 |
| _CPM_Rate |  |
| CZT Counter |  |
| +2.5 Volts monitor |  |
| +5 Volts monitor |  |
| _ROLL_ROT |  |
| _Roll_DEC | 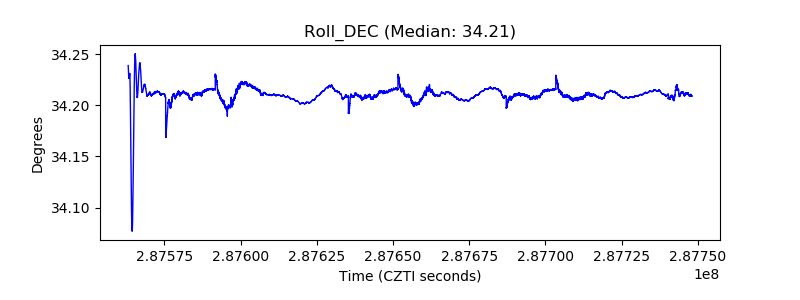 |
| _Roll_RA | 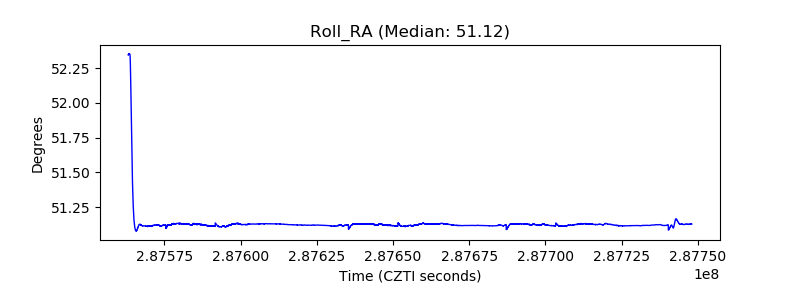 |
| Veto Counter |  |