| Param | Original file | Final file |
|---|---|---|
| Filename | modeM0/AS1C04_001T01_9000002716cztM0_level2_bc.evt | modeM0/AS1C04_001T01_9000002716cztM0_level2_quad_clean.evt |
| Size (bytes) | 2,987,156,160 | 1,411,133,760 |
| Size | 2.8 GB | 1.3 GB |
| Events in quadrant A | 19,223,465 | 9,661,929 |
| Events in quadrant B | 16,457,942 | 9,938,385 |
| Events in quadrant C | 14,872,088 | 9,451,839 |
| Events in quadrant D | 34,765,067 | 8,514,061 |
| Mode SS | |||
|---|---|---|---|
| Quadrant | BADHDUFLAG | Total packets | Discarded packets |
| A | 0 | 1544 | 0 |
| B | 0 | 1544 | 0 |
| C | 0 | 1544 | 0 |
| D | 0 | 1544 | 0 |
| Mode M9 | |||
|---|---|---|---|
| Quadrant | BADHDUFLAG | Total packets | Discarded packets |
| A | 0 | 135 | 0 |
| B | 0 | 135 | 0 |
| C | 0 | 135 | 0 |
| D | 0 | 135 | 0 |
| Mode M0 | |||
|---|---|---|---|
| Quadrant | BADHDUFLAG | Total packets | Discarded packets |
| A | 0 | 175551 | 0 |
| B | 0 | 157813 | 0 |
| C | 0 | 154208 | 0 |
| D | 0 | 244152 | 0 |
| Quadrant | Total seconds | Saturated seconds | Saturation percentage |
|---|---|---|---|
| A | 75487 | 3041 | 4.028508% |
| B | 75487 | 779 | 1.031966% |
| C | 75487 | 830 | 1.099527% |
| D | 75487 | 9533 | 12.628665% |
Noise dominated data is calculated using 1-second bins in cleaned event files. If a bin has >2000 counts, and if more than 50% of those come from <1% of pixels, then it is considered to be noise-dominated and hence unusable.
| Quadrant | # 1 sec bins | Bins with >0 counts | Bins with >2000 counts | High rate bins dominated by noise | Noise dominated (total time) | Noise dominated (detector-on time) | Marked lightcurve |
|---|---|---|---|---|---|---|---|
| A | 87912 | 75479 | 67 | 67 | 0.08% | 0.09% |  |
| B | 87910 | 75485 | 10 | 10 | 0.01% | 0.01% |  |
| C | 87910 | 75485 | 0 | 0 | 0.00% | 0.00% |  |
| D | 87910 | 75484 | 916 | 916 | 1.04% | 1.21% |  |
Top three noisy pixels from each quadrant. If the there are fewer than three noisy pixels in the level2.evt file, extra rows are filled as -1
| Pixel properties | Quadrant properties | ||||||
|---|---|---|---|---|---|---|---|
| Quadrant | DetID | PixID | Counts | Sigma | Mean | Median | Sigma |
| A | 15 | 174 | 4189657 | 4890.34 | 3885 | 3823 | 855.9 |
| A | 13 | 210 | 61874 | 67.82 | 3885 | 3823 | 855.9 |
| A | 11 | 29 | 44699 | 47.76 | 3885 | 3823 | 855.9 |
| B | 7 | 220 | 322973 | 428.22 | 3963 | 3876 | 745.2 |
| B | 3 | 64 | 291142 | 385.5 | 3963 | 3876 | 745.2 |
| B | 0 | 189 | 154887 | 202.65 | 3963 | 3876 | 745.2 |
| C | 3 | 233 | 308210 | 341.67 | 3766 | 3743 | 891.1 |
| C | 7 | 174 | 55895 | 58.52 | 3766 | 3743 | 891.1 |
| C | 13 | 61 | 22279 | 20.8 | 3766 | 3743 | 891.1 |
| D | 7 | 238 | 10817219 | 12766.13 | 3569 | 3446 | 847.1 |
| D | 5 | 222 | 4006388 | 4725.65 | 3569 | 3446 | 847.1 |
| D | 1 | 52 | 3724931 | 4393.37 | 3569 | 3446 | 847.1 |
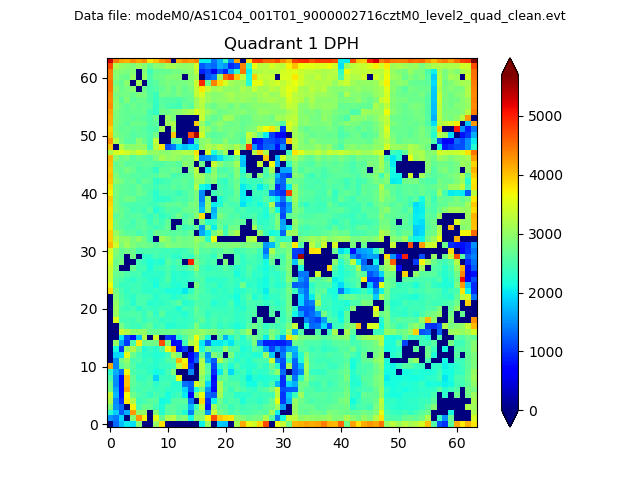
Histogram calculated using DETX and DETY for each event in the final _common_clean file
| Quadrant A |  |
 |
Quadrant B |
|---|---|---|---|
| Quadrant D |  |
 |
Quadrant C |
| Plot type | Count rate plots | Images |
|---|---|---|
| Comparison with Poisson distribution Blue bars denote a histogram of data divided into 1 sec bins. Red curve is a Poisson curve with rate = median count rate of data. |
 |
 |
| Quadrant-wise count rates Data is divided into 100 sec bins |
 |
|
| Module-wise count rates for Quadrant A Data is divided into 100 sec bins |
 |
 |
| Module-wise count rates for Quadrant B Data is divided into 100 sec bins |
 |
 |
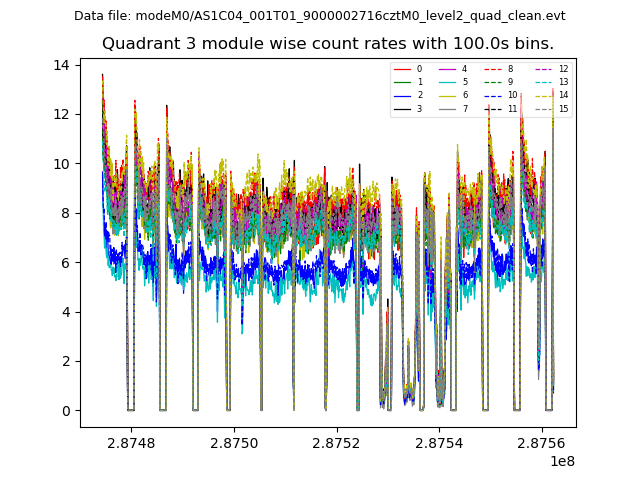
| Module-wise count rates for Quadrant C Data is divided into 100 sec bins |
 |
 |
| Module-wise count rates for Quadrant D Data is divided into 100 sec bins |
 |
 |
| Parameter | Plot |
|---|---|
| CZT HV Monitor |  |
| D_VDD |  |
| Temperature 1 |  |
| Veto HV Monitor |  |
| Veto LLD |  |
| Alpha Counter |  |
| _CPM_Rate |  |
| CZT Counter |  |
| +2.5 Volts monitor |  |
| +5 Volts monitor |  |
| _ROLL_ROT |  |
| _Roll_DEC |  |
| _Roll_RA |  |
| Veto Counter |  |