| Param | Original file | Final file |
|---|---|---|
| Filename | modeM0/AS1C04_009T03_9000002714cztM0_level2_bc.evt | modeM0/AS1C04_009T03_9000002714cztM0_level2_quad_clean.evt |
| Size (bytes) | 769,910,400 | 431,377,920 |
| Size | 734.2 MB | 411.4 MB |
| Events in quadrant A | 5,058,492 | 2,908,321 |
| Events in quadrant B | 4,991,102 | 2,957,395 |
| Events in quadrant C | 4,515,664 | 2,837,665 |
| Events in quadrant D | 7,164,859 | 2,768,127 |
| Mode M0 | |||
|---|---|---|---|
| Quadrant | BADHDUFLAG | Total packets | Discarded packets |
| A | 0 | 48952 | 0 |
| B | 0 | 48469 | 0 |
| C | 0 | 47232 | 0 |
| D | 0 | 55678 | 0 |
| Mode SS | |||
|---|---|---|---|
| Quadrant | BADHDUFLAG | Total packets | Discarded packets |
| A | 0 | 474 | 0 |
| B | 0 | 474 | 0 |
| C | 0 | 474 | 0 |
| D | 0 | 474 | 0 |
| Mode M9 | |||
|---|---|---|---|
| Quadrant | BADHDUFLAG | Total packets | Discarded packets |
| A | 0 | 40 | 0 |
| B | 0 | 40 | 0 |
| C | 0 | 40 | 0 |
| D | 0 | 40 | 0 |
| Quadrant | Total seconds | Saturated seconds | Saturation percentage |
|---|---|---|---|
| A | 23184 | 203 | 0.875604% |
| B | 23184 | 173 | 0.746204% |
| C | 23184 | 157 | 0.677191% |
| D | 23184 | 460 | 1.984127% |
Noise dominated data is calculated using 1-second bins in cleaned event files. If a bin has >2000 counts, and if more than 50% of those come from <1% of pixels, then it is considered to be noise-dominated and hence unusable.
| Quadrant | # 1 sec bins | Bins with >0 counts | Bins with >2000 counts | High rate bins dominated by noise | Noise dominated (total time) | Noise dominated (detector-on time) | Marked lightcurve |
|---|---|---|---|---|---|---|---|
| A | 27254 | 23184 | 1 | 1 | 0.00% | 0.00% |  |
| B | 27254 | 23184 | 0 | 0 | 0.00% | 0.00% |  |
| C | 27254 | 23184 | 0 | 0 | 0.00% | 0.00% | 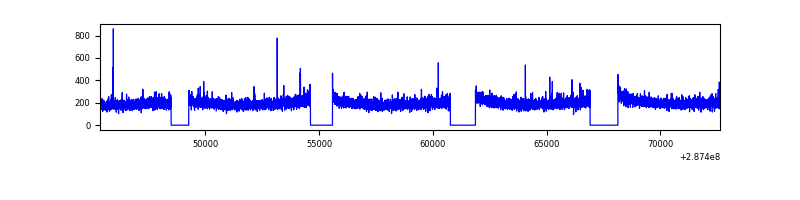 |
| D | 27254 | 23185 | 43 | 43 | 0.16% | 0.19% |  |
Top three noisy pixels from each quadrant. If the there are fewer than three noisy pixels in the level2.evt file, extra rows are filled as -1
| Pixel properties | Quadrant properties | ||||||
|---|---|---|---|---|---|---|---|
| Quadrant | DetID | PixID | Counts | Sigma | Mean | Median | Sigma |
| A | 15 | 174 | 436910 | 1647.86 | 1198 | 1175 | 264.4 |
| A | 8 | 34 | 11805 | 40.2 | 1198 | 1175 | 264.4 |
| A | 4 | 2 | 10983 | 37.09 | 1198 | 1175 | 264.4 |
| B | 7 | 220 | 147295 | 633.26 | 1209 | 1181 | 230.7 |
| B | 0 | 189 | 77802 | 332.07 | 1209 | 1181 | 230.7 |
| B | 0 | 198 | 25380 | 104.88 | 1209 | 1181 | 230.7 |
| C | 3 | 233 | 32981 | 115.9 | 1155 | 1150 | 274.6 |
| C | 0 | 207 | 18278 | 62.37 | 1155 | 1150 | 274.6 |
| C | 8 | 128 | 12010 | 39.54 | 1155 | 1150 | 274.6 |
| D | 1 | 52 | 1479513 | 5346.22 | 1177 | 1138 | 276.5 |
| D | 7 | 238 | 700870 | 2530.43 | 1177 | 1138 | 276.5 |
| D | 2 | 33 | 147101 | 527.84 | 1177 | 1138 | 276.5 |
Histogram calculated using DETX and DETY for each event in the final _common_clean file
| Quadrant A |  |
 |
Quadrant B |
|---|---|---|---|
| Quadrant D |  |
 |
Quadrant C |
| Plot type | Count rate plots | Images |
|---|---|---|
| Comparison with Poisson distribution Blue bars denote a histogram of data divided into 1 sec bins. Red curve is a Poisson curve with rate = median count rate of data. |
 |
 |
| Quadrant-wise count rates Data is divided into 100 sec bins |
 |
|
| Module-wise count rates for Quadrant A Data is divided into 100 sec bins |
 |
 |
| Module-wise count rates for Quadrant B Data is divided into 100 sec bins |
 |
 |
| Module-wise count rates for Quadrant C Data is divided into 100 sec bins |
 |
 |
| Module-wise count rates for Quadrant D Data is divided into 100 sec bins |
 |
 |
| Parameter | Plot |
|---|---|
| CZT HV Monitor |  |
| D_VDD |  |
| Temperature 1 |  |
| Veto HV Monitor |  |
| Veto LLD |  |
| Alpha Counter |  |
| _CPM_Rate |  |
| CZT Counter |  |
| +2.5 Volts monitor |  |
| +5 Volts monitor |  |
| _ROLL_ROT |  |
| _Roll_DEC |  |
| _Roll_RA |  |
| Veto Counter |  |