| Param | Original file | Final file |
|---|---|---|
| Filename | modeM0/AS1T03_003T01_9000002712cztM0_level2_bc.evt | modeM0/AS1T03_003T01_9000002712cztM0_level2_quad_clean.evt |
| Size (bytes) | 3,267,982,080 | 1,020,631,680 |
| Size | 3.0 GB | 973.4 MB |
| Events in quadrant A | 19,642,692 | 6,442,232 |
| Events in quadrant B | 18,104,179 | 6,541,942 |
| Events in quadrant C | 18,992,846 | 6,276,836 |
| Events in quadrant D | 36,654,552 | 6,039,009 |
| Mode M9 | |||
|---|---|---|---|
| Quadrant | BADHDUFLAG | Total packets | Discarded packets |
| A | 0 | 125 | 0 |
| B | 0 | 125 | 0 |
| C | 0 | 125 | 0 |
| D | 0 | 125 | 0 |
| Mode M0 | |||
|---|---|---|---|
| Quadrant | BADHDUFLAG | Total packets | Discarded packets |
| A | 0 | 181467 | 0 |
| B | 0 | 173289 | 0 |
| C | 0 | 179775 | 0 |
| D | 0 | 243657 | 0 |
| Mode SS | |||
|---|---|---|---|
| Quadrant | BADHDUFLAG | Total packets | Discarded packets |
| A | 0 | 1670 | 0 |
| B | 0 | 1670 | 0 |
| C | 0 | 1670 | 0 |
| D | 0 | 1668 | 0 |
| Quadrant | Total seconds | Saturated seconds | Saturation percentage |
|---|---|---|---|
| A | 81900 | 1933 | 2.360195% |
| B | 81899 | 1147 | 1.400506% |
| C | 81835 | 2224 | 2.717664% |
| D | 81836 | 5681 | 6.941933% |
Noise dominated data is calculated using 1-second bins in cleaned event files. If a bin has >2000 counts, and if more than 50% of those come from <1% of pixels, then it is considered to be noise-dominated and hence unusable.
| Quadrant | # 1 sec bins | Bins with >0 counts | Bins with >2000 counts | High rate bins dominated by noise | Noise dominated (total time) | Noise dominated (detector-on time) | Marked lightcurve |
|---|---|---|---|---|---|---|---|
| A | 94528 | 81972 | 46 | 46 | 0.05% | 0.06% |  |
| B | 94528 | 81972 | 4 | 4 | 0.00% | 0.00% |  |
| C | 94528 | 81944 | 46 | 46 | 0.05% | 0.06% |  |
| D | 94527 | 81940 | 657 | 657 | 0.70% | 0.80% |  |
Top three noisy pixels from each quadrant. If the there are fewer than three noisy pixels in the level2.evt file, extra rows are filled as -1
| Pixel properties | Quadrant properties | ||||||
|---|---|---|---|---|---|---|---|
| Quadrant | DetID | PixID | Counts | Sigma | Mean | Median | Sigma |
| A | 15 | 174 | 2825306 | 3024.77 | 4340 | 4261 | 932.6 |
| A | 4 | 2 | 46505 | 45.29 | 4340 | 4261 | 932.6 |
| A | 13 | 210 | 45163 | 43.86 | 4340 | 4261 | 932.6 |
| B | 7 | 220 | 425811 | 512.93 | 4374 | 4267 | 821.8 |
| B | 4 | 171 | 155277 | 183.75 | 4374 | 4267 | 821.8 |
| B | 0 | 189 | 128951 | 151.71 | 4374 | 4267 | 821.8 |
| C | 4 | 254 | 2728063 | 2813.51 | 4159 | 4132 | 968.2 |
| C | 3 | 233 | 213552 | 216.31 | 4159 | 4132 | 968.2 |
| C | 0 | 207 | 39281 | 36.3 | 4159 | 4132 | 968.2 |
| D | 7 | 238 | 9314812 | 9612.06 | 4187 | 4042 | 968.7 |
| D | 5 | 222 | 6270930 | 6469.68 | 4187 | 4042 | 968.7 |
| D | 1 | 52 | 3358774 | 3463.29 | 4187 | 4042 | 968.7 |
Histogram calculated using DETX and DETY for each event in the final _common_clean file
| Quadrant A |  |
 |
Quadrant B |
|---|---|---|---|
| Quadrant D |  |
 |
Quadrant C |
| Plot type | Count rate plots | Images |
|---|---|---|
| Comparison with Poisson distribution Blue bars denote a histogram of data divided into 1 sec bins. Red curve is a Poisson curve with rate = median count rate of data. |
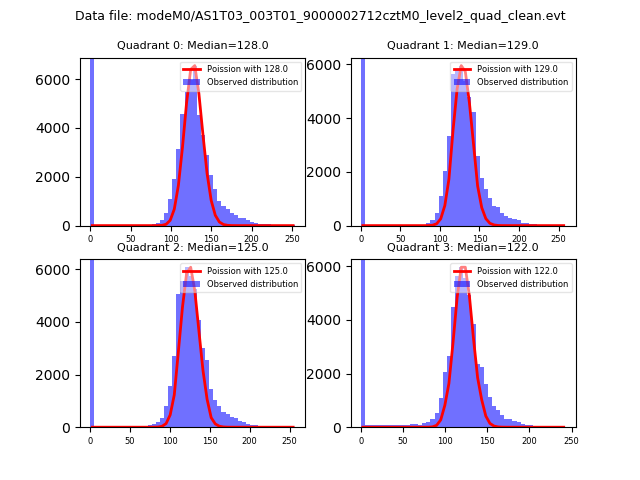 |
 |
| Quadrant-wise count rates Data is divided into 100 sec bins |
 |
|
| Module-wise count rates for Quadrant A Data is divided into 100 sec bins |
 |
 |
| Module-wise count rates for Quadrant B Data is divided into 100 sec bins |
 |
 |
| Module-wise count rates for Quadrant C Data is divided into 100 sec bins |
 |
 |
| Module-wise count rates for Quadrant D Data is divided into 100 sec bins |
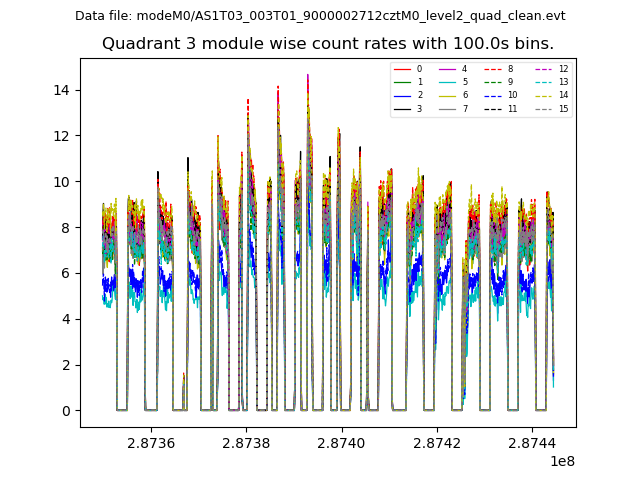 |
 |
| Parameter | Plot |
|---|---|
| CZT HV Monitor |  |
| D_VDD |  |
| Temperature 1 |  |
| Veto HV Monitor |  |
| Veto LLD |  |
| Alpha Counter |  |
| _CPM_Rate | 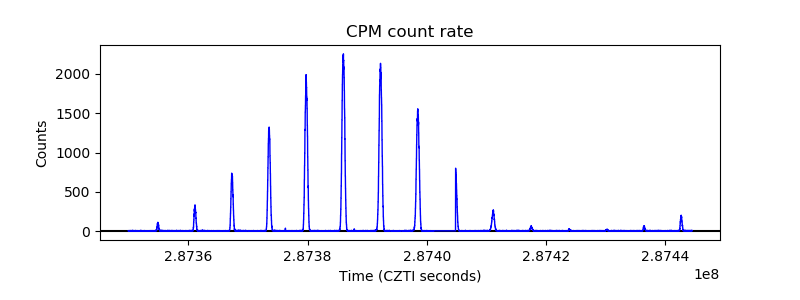 |
| CZT Counter |  |
| +2.5 Volts monitor |  |
| +5 Volts monitor |  |
| _ROLL_ROT |  |
| _Roll_DEC |  |
| _Roll_RA |  |
| Veto Counter |  |