| Param | Original file | Final file |
|---|---|---|
| Filename | modeM0/AS1A05_160T02_9000002710cztM0_level2_bc.evt | modeM0/AS1A05_160T02_9000002710cztM0_level2_quad_clean.evt |
| Size (bytes) | 3,795,984,000 | 1,254,798,720 |
| Size | 3.5 GB | 1.2 GB |
| Events in quadrant A | 21,690,509 | 7,901,649 |
| Events in quadrant B | 22,698,107 | 7,974,051 |
| Events in quadrant C | 27,181,452 | 7,675,854 |
| Events in quadrant D | 36,526,607 | 7,546,955 |
| Mode SS | |||
|---|---|---|---|
| Quadrant | BADHDUFLAG | Total packets | Discarded packets |
| A | 0 | 2062 | 0 |
| B | 0 | 2062 | 0 |
| C | 0 | 2062 | 0 |
| D | 0 | 2062 | 0 |
| Mode M9 | |||
|---|---|---|---|
| Quadrant | BADHDUFLAG | Total packets | Discarded packets |
| A | 0 | 146 | 0 |
| B | 0 | 146 | 0 |
| C | 0 | 146 | 0 |
| D | 0 | 146 | 0 |
| Mode M0 | |||
|---|---|---|---|
| Quadrant | BADHDUFLAG | Total packets | Discarded packets |
| A | 0 | 211983 | 0 |
| B | 0 | 215654 | 0 |
| C | 0 | 237082 | 0 |
| D | 0 | 262869 | 0 |
| Quadrant | Total seconds | Saturated seconds | Saturation percentage |
|---|---|---|---|
| A | 100768 | 1399 | 1.388338% |
| B | 100768 | 1728 | 1.714830% |
| C | 100768 | 4152 | 4.120356% |
| D | 100768 | 3738 | 3.709511% |
Noise dominated data is calculated using 1-second bins in cleaned event files. If a bin has >2000 counts, and if more than 50% of those come from <1% of pixels, then it is considered to be noise-dominated and hence unusable.
| Quadrant | # 1 sec bins | Bins with >0 counts | Bins with >2000 counts | High rate bins dominated by noise | Noise dominated (total time) | Noise dominated (detector-on time) | Marked lightcurve |
|---|---|---|---|---|---|---|---|
| A | 115813 | 100773 | 20 | 20 | 0.02% | 0.02% |  |
| B | 115813 | 100772 | 8 | 8 | 0.01% | 0.01% |  |
| C | 115813 | 100768 | 141 | 141 | 0.12% | 0.14% |  |
| D | 115813 | 100770 | 584 | 584 | 0.50% | 0.58% |  |
Top three noisy pixels from each quadrant. If the there are fewer than three noisy pixels in the level2.evt file, extra rows are filled as -1
| Pixel properties | Quadrant properties | ||||||
|---|---|---|---|---|---|---|---|
| Quadrant | DetID | PixID | Counts | Sigma | Mean | Median | Sigma |
| A | 15 | 174 | 560477 | 476.36 | 5402 | 5310 | 1165.4 |
| A | 4 | 2 | 347678 | 293.77 | 5402 | 5310 | 1165.4 |
| A | 0 | 226 | 35809 | 26.17 | 5402 | 5310 | 1165.4 |
| B | 7 | 220 | 537333 | 524.77 | 5409 | 5269 | 1013.9 |
| B | 0 | 189 | 315579 | 306.05 | 5409 | 5269 | 1013.9 |
| B | 0 | 229 | 282005 | 272.94 | 5409 | 5269 | 1013.9 |
| C | 4 | 254 | 7298732 | 6132.44 | 5129 | 5107 | 1189.4 |
| C | 3 | 233 | 76758 | 60.24 | 5129 | 5107 | 1189.4 |
| C | 8 | 128 | 34805 | 24.97 | 5129 | 5107 | 1189.4 |
| D | 7 | 238 | 7947364 | 6500.2 | 5287 | 5103 | 1221.8 |
| D | 5 | 222 | 4192148 | 3426.81 | 5287 | 5103 | 1221.8 |
| D | 10 | 70 | 886123 | 721.05 | 5287 | 5103 | 1221.8 |
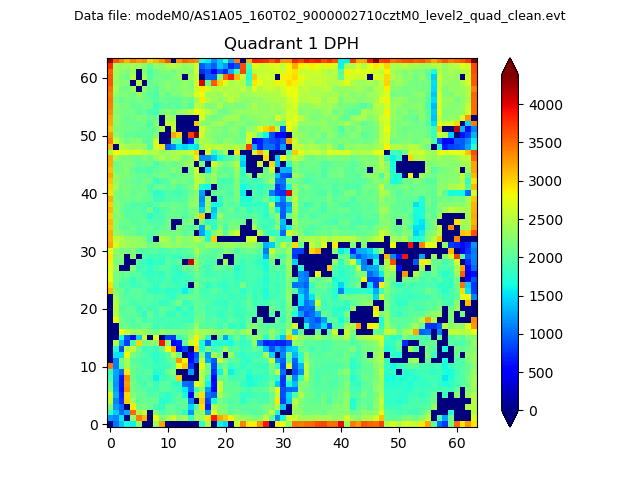
Histogram calculated using DETX and DETY for each event in the final _common_clean file
| Quadrant A |  |
 |
Quadrant B |
|---|---|---|---|
| Quadrant D |  |
 |
Quadrant C |
| Plot type | Count rate plots | Images |
|---|---|---|
| Comparison with Poisson distribution Blue bars denote a histogram of data divided into 1 sec bins. Red curve is a Poisson curve with rate = median count rate of data. |
 |
 |
| Quadrant-wise count rates Data is divided into 100 sec bins |
 |
|
| Module-wise count rates for Quadrant A Data is divided into 100 sec bins |
 |
 |
| Module-wise count rates for Quadrant B Data is divided into 100 sec bins |
 |
 |
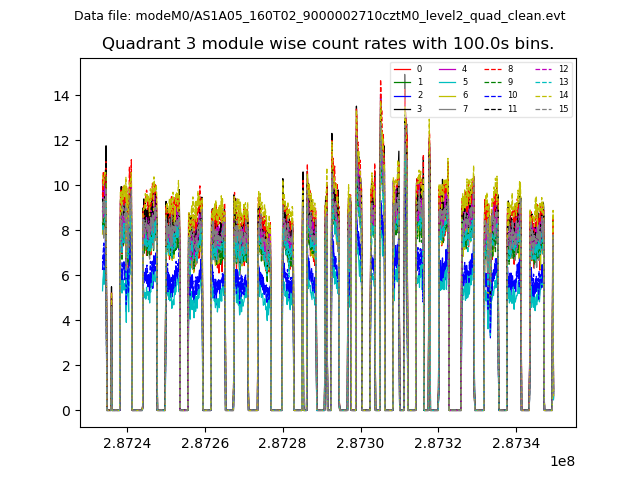
| Module-wise count rates for Quadrant C Data is divided into 100 sec bins |
 |
 |
| Module-wise count rates for Quadrant D Data is divided into 100 sec bins |
 |
 |
| Parameter | Plot |
|---|---|
| CZT HV Monitor |  |
| D_VDD |  |
| Temperature 1 | 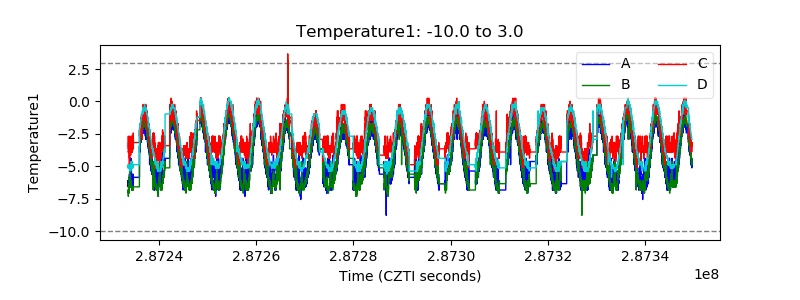 |
| Veto HV Monitor |  |
| Veto LLD |  |
| Alpha Counter |  |
| _CPM_Rate |  |
| CZT Counter |  |
| +2.5 Volts monitor |  |
| +5 Volts monitor |  |
| _ROLL_ROT |  |
| _Roll_DEC |  |
| _Roll_RA | 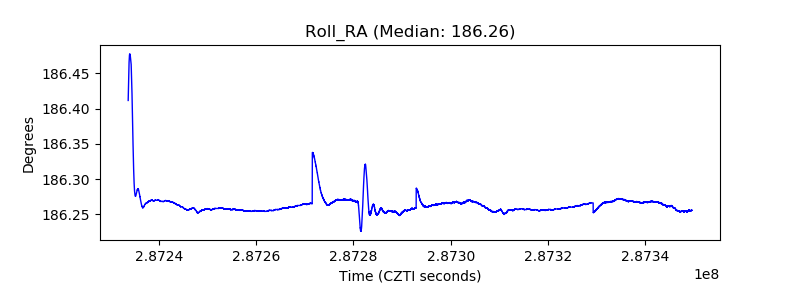 |
| Veto Counter |  |