| Param | Original file | Final file |
|---|---|---|
| Filename | modeM0/AS1A05_176T05_9000002706cztM0_level2_bc.evt | modeM0/AS1A05_176T05_9000002706cztM0_level2_quad_clean.evt |
| Size (bytes) | 401,544,000 | 111,525,120 |
| Size | 382.9 MB | 106.4 MB |
| Events in quadrant A | 2,053,363 | 688,208 |
| Events in quadrant B | 2,191,617 | 693,891 |
| Events in quadrant C | 2,552,853 | 676,762 |
| Events in quadrant D | 4,711,444 | 662,417 |
| Mode SS | |||
|---|---|---|---|
| Quadrant | BADHDUFLAG | Total packets | Discarded packets |
| A | 0 | 192 | 0 |
| B | 0 | 192 | 0 |
| C | 0 | 192 | 0 |
| D | 0 | 192 | 0 |
| Mode M9 | |||
|---|---|---|---|
| Quadrant | BADHDUFLAG | Total packets | Discarded packets |
| A | 0 | 19 | 0 |
| B | 0 | 19 | 0 |
| C | 0 | 19 | 0 |
| D | 0 | 19 | 0 |
| Mode M0 | |||
|---|---|---|---|
| Quadrant | BADHDUFLAG | Total packets | Discarded packets |
| A | 0 | 20116 | 0 |
| B | 0 | 20659 | 0 |
| C | 0 | 22376 | 0 |
| D | 0 | 29477 | 0 |
| Quadrant | Total seconds | Saturated seconds | Saturation percentage |
|---|---|---|---|
| A | 9462 | 275 | 2.906362% |
| B | 9462 | 241 | 2.547030% |
| C | 9462 | 480 | 5.072923% |
| D | 9462 | 628 | 6.637075% |
Noise dominated data is calculated using 1-second bins in cleaned event files. If a bin has >2000 counts, and if more than 50% of those come from <1% of pixels, then it is considered to be noise-dominated and hence unusable.
| Quadrant | # 1 sec bins | Bins with >0 counts | Bins with >2000 counts | High rate bins dominated by noise | Noise dominated (total time) | Noise dominated (detector-on time) | Marked lightcurve |
|---|---|---|---|---|---|---|---|
| A | 11332 | 9463 | 3 | 3 | 0.03% | 0.03% |  |
| B | 11332 | 9462 | 1 | 1 | 0.01% | 0.01% |  |
| C | 11332 | 9461 | 9 | 9 | 0.08% | 0.10% |  |
| D | 11332 | 9463 | 32 | 32 | 0.28% | 0.34% | 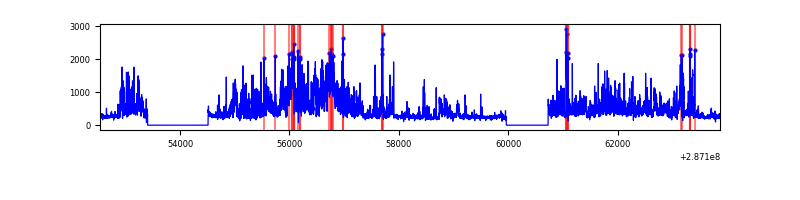 |
Top three noisy pixels from each quadrant. If the there are fewer than three noisy pixels in the level2.evt file, extra rows are filled as -1
| Pixel properties | Quadrant properties | ||||||
|---|---|---|---|---|---|---|---|
| Quadrant | DetID | PixID | Counts | Sigma | Mean | Median | Sigma |
| A | 15 | 174 | 51448 | 448.92 | 509 | 498 | 113.5 |
| A | 4 | 2 | 42614 | 371.08 | 509 | 498 | 113.5 |
| A | 3 | 15 | 5167 | 41.14 | 509 | 498 | 113.5 |
| B | 0 | 189 | 118317 | 1196.39 | 510 | 497 | 98.5 |
| B | 7 | 220 | 35073 | 351.1 | 510 | 497 | 98.5 |
| B | 0 | 197 | 21511 | 213.38 | 510 | 497 | 98.5 |
| C | 4 | 254 | 660373 | 5746.2 | 488 | 484 | 114.8 |
| C | 4 | 238 | 3306 | 24.57 | 488 | 484 | 114.8 |
| C | 9 | 160 | 3033 | 22.2 | 488 | 484 | 114.8 |
| D | 7 | 238 | 1793552 | 15109.32 | 500 | 482 | 118.7 |
| D | 13 | 168 | 529490 | 4457.69 | 500 | 482 | 118.7 |
| D | 10 | 70 | 161652 | 1358.1 | 500 | 482 | 118.7 |
Histogram calculated using DETX and DETY for each event in the final _common_clean file
| Quadrant A |  |
 |
Quadrant B |
|---|---|---|---|
| Quadrant D |  |
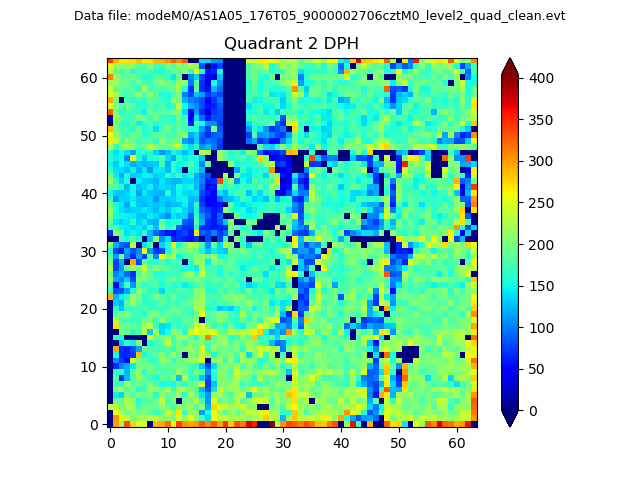 |
Quadrant C |
| Plot type | Count rate plots | Images |
|---|---|---|
| Comparison with Poisson distribution Blue bars denote a histogram of data divided into 1 sec bins. Red curve is a Poisson curve with rate = median count rate of data. |
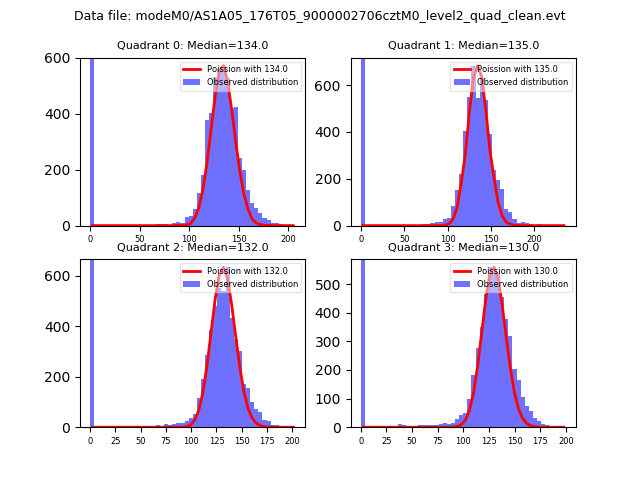 |
 |
| Quadrant-wise count rates Data is divided into 100 sec bins |
 |
|
| Module-wise count rates for Quadrant A Data is divided into 100 sec bins |
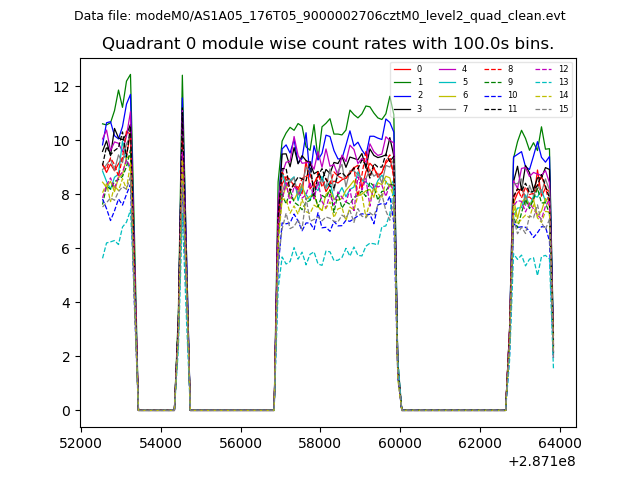 |
 |
| Module-wise count rates for Quadrant B Data is divided into 100 sec bins |
 |
 |
| Module-wise count rates for Quadrant C Data is divided into 100 sec bins |
 |
 |
| Module-wise count rates for Quadrant D Data is divided into 100 sec bins |
 |
 |
| Parameter | Plot |
|---|---|
| CZT HV Monitor |  |
| D_VDD |  |
| Temperature 1 |  |
| Veto HV Monitor |  |
| Veto LLD |  |
| Alpha Counter | 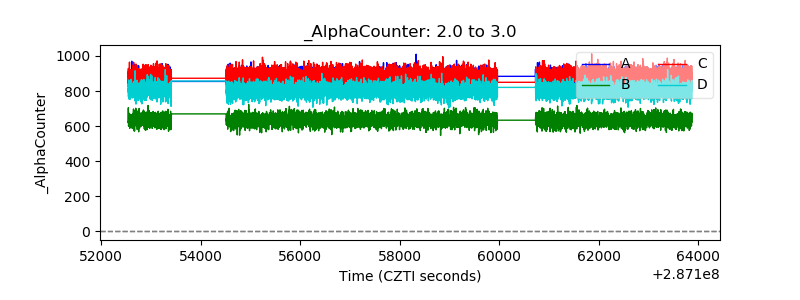 |
| _CPM_Rate |  |
| CZT Counter |  |
| +2.5 Volts monitor |  |
| +5 Volts monitor |  |
| _ROLL_ROT |  |
| _Roll_DEC |  |
| _Roll_RA |  |
| Veto Counter |  |