| Param | Original file | Final file |
|---|---|---|
| Filename | modeM0/AS1A05_063T02_9000002708cztM0_level2_bc.evt | modeM0/AS1A05_063T02_9000002708cztM0_level2_quad_clean.evt |
| Size (bytes) | 2,434,400,640 | 726,183,360 |
| Size | 2.3 GB | 692.5 MB |
| Events in quadrant A | 13,723,646 | 4,549,832 |
| Events in quadrant B | 13,879,908 | 4,599,605 |
| Events in quadrant C | 14,756,775 | 4,431,047 |
| Events in quadrant D | 27,295,227 | 4,315,638 |
| Mode M9 | |||
|---|---|---|---|
| Quadrant | BADHDUFLAG | Total packets | Discarded packets |
| A | 0 | 91 | 0 |
| B | 0 | 91 | 0 |
| C | 0 | 91 | 0 |
| D | 0 | 91 | 0 |
| Mode M0 | |||
|---|---|---|---|
| Quadrant | BADHDUFLAG | Total packets | Discarded packets |
| A | 0 | 128889 | 0 |
| B | 0 | 129766 | 0 |
| C | 0 | 134768 | 0 |
| D | 0 | 171425 | 0 |
| Mode SS | |||
|---|---|---|---|
| Quadrant | BADHDUFLAG | Total packets | Discarded packets |
| A | 0 | 1218 | 0 |
| B | 0 | 1218 | 0 |
| C | 0 | 1218 | 0 |
| D | 0 | 1218 | 0 |
| Quadrant | Total seconds | Saturated seconds | Saturation percentage |
|---|---|---|---|
| A | 59753 | 745 | 1.246799% |
| B | 59753 | 1151 | 1.926263% |
| C | 59753 | 1690 | 2.828310% |
| D | 59753 | 3376 | 5.649926% |
Noise dominated data is calculated using 1-second bins in cleaned event files. If a bin has >2000 counts, and if more than 50% of those come from <1% of pixels, then it is considered to be noise-dominated and hence unusable.
| Quadrant | # 1 sec bins | Bins with >0 counts | Bins with >2000 counts | High rate bins dominated by noise | Noise dominated (total time) | Noise dominated (detector-on time) | Marked lightcurve |
|---|---|---|---|---|---|---|---|
| A | 68874 | 59754 | 30 | 30 | 0.04% | 0.05% |  |
| B | 68874 | 59752 | 48 | 48 | 0.07% | 0.08% |  |
| C | 68874 | 59752 | 58 | 58 | 0.08% | 0.10% |  |
| D | 68874 | 59753 | 468 | 468 | 0.68% | 0.78% |  |
Top three noisy pixels from each quadrant. If the there are fewer than three noisy pixels in the level2.evt file, extra rows are filled as -1
| Pixel properties | Quadrant properties | ||||||
|---|---|---|---|---|---|---|---|
| Quadrant | DetID | PixID | Counts | Sigma | Mean | Median | Sigma |
| A | 15 | 174 | 996388 | 1430.89 | 3226 | 3172 | 694.1 |
| A | 4 | 2 | 317547 | 452.91 | 3226 | 3172 | 694.1 |
| A | 11 | 29 | 25355 | 31.96 | 3226 | 3172 | 694.1 |
| B | 7 | 220 | 389513 | 644.87 | 3225 | 3147 | 599.1 |
| B | 4 | 171 | 297364 | 491.07 | 3225 | 3147 | 599.1 |
| B | 10 | 247 | 235208 | 387.32 | 3225 | 3147 | 599.1 |
| C | 4 | 254 | 2790925 | 3903.94 | 3076 | 3058 | 714.1 |
| C | 3 | 233 | 66282 | 88.53 | 3076 | 3058 | 714.1 |
| C | 1 | 208 | 28983 | 36.3 | 3076 | 3058 | 714.1 |
| D | 7 | 238 | 12865063 | 17508.11 | 3147 | 3038 | 734.6 |
| D | 13 | 168 | 620048 | 839.89 | 3147 | 3038 | 734.6 |
| D | 5 | 222 | 412360 | 557.18 | 3147 | 3038 | 734.6 |
Histogram calculated using DETX and DETY for each event in the final _common_clean file
| Quadrant A |  |
 |
Quadrant B |
|---|---|---|---|
| Quadrant D |  |
 |
Quadrant C |
| Plot type | Count rate plots | Images |
|---|---|---|
| Comparison with Poisson distribution Blue bars denote a histogram of data divided into 1 sec bins. Red curve is a Poisson curve with rate = median count rate of data. |
 |
 |
| Quadrant-wise count rates Data is divided into 100 sec bins |
 |
|
| Module-wise count rates for Quadrant A Data is divided into 100 sec bins |
 |
 |
| Module-wise count rates for Quadrant B Data is divided into 100 sec bins |
 |
 |
| Module-wise count rates for Quadrant C Data is divided into 100 sec bins |
 |
 |
| Module-wise count rates for Quadrant D Data is divided into 100 sec bins |
 |
 |
| Parameter | Plot |
|---|---|
| CZT HV Monitor |  |
| D_VDD |  |
| Temperature 1 |  |
| Veto HV Monitor |  |
| Veto LLD |  |
| Alpha Counter | 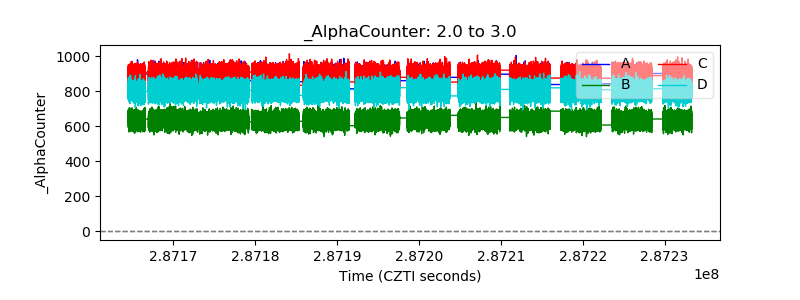 |
| _CPM_Rate | 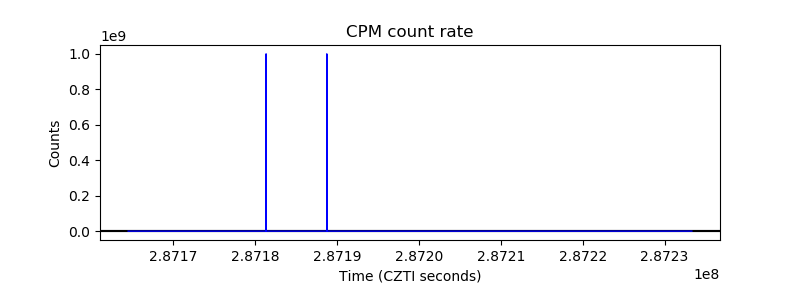 |
| CZT Counter | 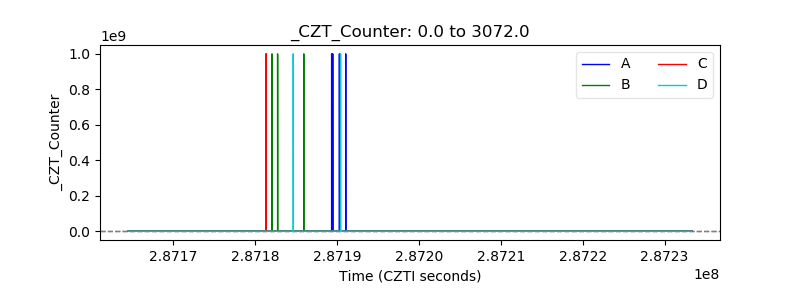 |
| +2.5 Volts monitor |  |
| +5 Volts monitor |  |
| _ROLL_ROT |  |
| _Roll_DEC |  |
| _Roll_RA |  |
| Veto Counter |  |