| Param | Original file | Final file |
|---|---|---|
| Filename | modeM0/AS1T03_014T01_9000002704cztM0_level2_bc.evt | modeM0/AS1T03_014T01_9000002704cztM0_level2_quad_clean.evt |
| Size (bytes) | 1,950,079,680 | 612,576,000 |
| Size | 1.8 GB | 584.2 MB |
| Events in quadrant A | 12,716,818 | 3,817,881 |
| Events in quadrant B | 11,135,187 | 3,902,979 |
| Events in quadrant C | 12,508,530 | 3,756,375 |
| Events in quadrant D | 19,352,239 | 3,707,636 |
| Mode M9 | |||
|---|---|---|---|
| Quadrant | BADHDUFLAG | Total packets | Discarded packets |
| A | 0 | 89 | 0 |
| B | 0 | 89 | 0 |
| C | 0 | 89 | 0 |
| D | 0 | 89 | 0 |
| Mode SS | |||
|---|---|---|---|
| Quadrant | BADHDUFLAG | Total packets | Discarded packets |
| A | 0 | 1002 | 0 |
| B | 0 | 1002 | 0 |
| C | 0 | 1002 | 0 |
| D | 0 | 1002 | 0 |
| Mode M0 | |||
|---|---|---|---|
| Quadrant | BADHDUFLAG | Total packets | Discarded packets |
| A | 0 | 110832 | 0 |
| B | 0 | 104667 | 0 |
| C | 0 | 112029 | 0 |
| D | 0 | 130371 | 0 |
| Quadrant | Total seconds | Saturated seconds | Saturation percentage |
|---|---|---|---|
| A | 49093 | 1064 | 2.167315% |
| B | 49093 | 598 | 1.218096% |
| C | 49093 | 1445 | 2.943393% |
| D | 49093 | 1005 | 2.047135% |
Noise dominated data is calculated using 1-second bins in cleaned event files. If a bin has >2000 counts, and if more than 50% of those come from <1% of pixels, then it is considered to be noise-dominated and hence unusable.
| Quadrant | # 1 sec bins | Bins with >0 counts | Bins with >2000 counts | High rate bins dominated by noise | Noise dominated (total time) | Noise dominated (detector-on time) | Marked lightcurve |
|---|---|---|---|---|---|---|---|
| A | 58128 | 49096 | 56 | 56 | 0.10% | 0.11% |  |
| B | 58128 | 49094 | 3 | 3 | 0.01% | 0.01% |  |
| C | 58128 | 49093 | 52 | 52 | 0.09% | 0.11% | 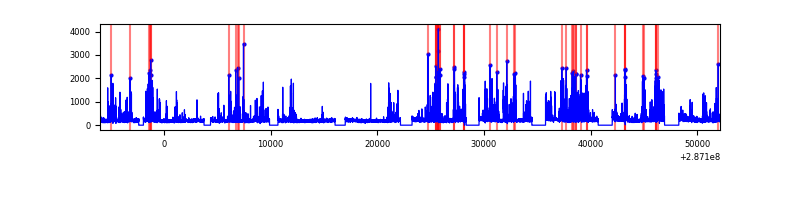 |
| D | 58128 | 49093 | 98 | 98 | 0.17% | 0.20% |  |
Top three noisy pixels from each quadrant. If the there are fewer than three noisy pixels in the level2.evt file, extra rows are filled as -1
| Pixel properties | Quadrant properties | ||||||
|---|---|---|---|---|---|---|---|
| Quadrant | DetID | PixID | Counts | Sigma | Mean | Median | Sigma |
| A | 15 | 174 | 2368837 | 4107.45 | 2683 | 2636 | 576.1 |
| A | 4 | 2 | 50475 | 83.04 | 2683 | 2636 | 576.1 |
| A | 0 | 226 | 17790 | 26.31 | 2683 | 2636 | 576.1 |
| B | 7 | 220 | 295615 | 581.63 | 2707 | 2645 | 503.7 |
| B | 0 | 189 | 184310 | 360.66 | 2707 | 2645 | 503.7 |
| B | 0 | 229 | 52591 | 99.16 | 2707 | 2645 | 503.7 |
| C | 4 | 254 | 2495493 | 4160.44 | 2584 | 2574 | 599.2 |
| C | 3 | 233 | 28504 | 43.27 | 2584 | 2574 | 599.2 |
| C | 5 | 218 | 26285 | 39.57 | 2584 | 2574 | 599.2 |
| D | 7 | 238 | 6642809 | 10777.81 | 2665 | 2571 | 616.1 |
| D | 10 | 70 | 524542 | 847.21 | 2665 | 2571 | 616.1 |
| D | 13 | 168 | 496849 | 802.27 | 2665 | 2571 | 616.1 |
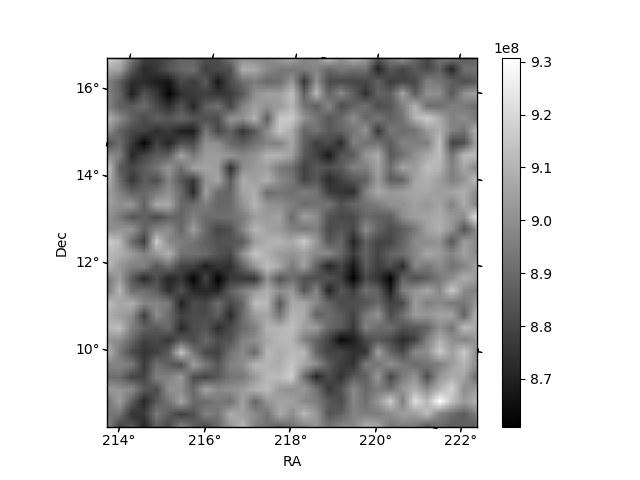
Histogram calculated using DETX and DETY for each event in the final _common_clean file
| Quadrant A |  |
 |
Quadrant B |
|---|---|---|---|
| Quadrant D |  |
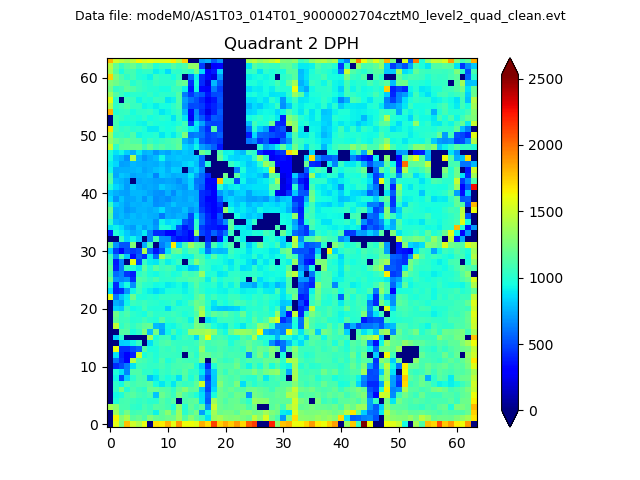 |
Quadrant C |
| Plot type | Count rate plots | Images |
|---|---|---|
| Comparison with Poisson distribution Blue bars denote a histogram of data divided into 1 sec bins. Red curve is a Poisson curve with rate = median count rate of data. |
 |
 |
| Quadrant-wise count rates Data is divided into 100 sec bins |
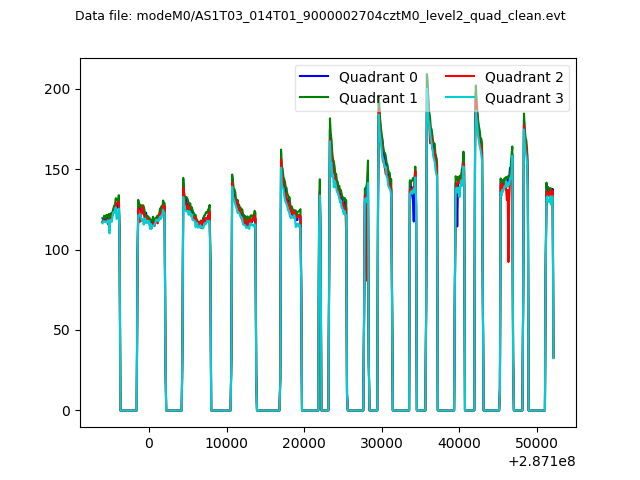 |
|
| Module-wise count rates for Quadrant A Data is divided into 100 sec bins |
 |
 |
| Module-wise count rates for Quadrant B Data is divided into 100 sec bins |
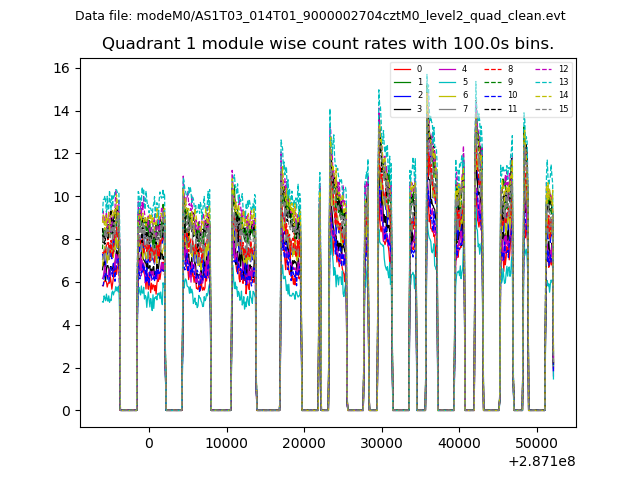 |
 |
| Module-wise count rates for Quadrant C Data is divided into 100 sec bins |
 |
 |
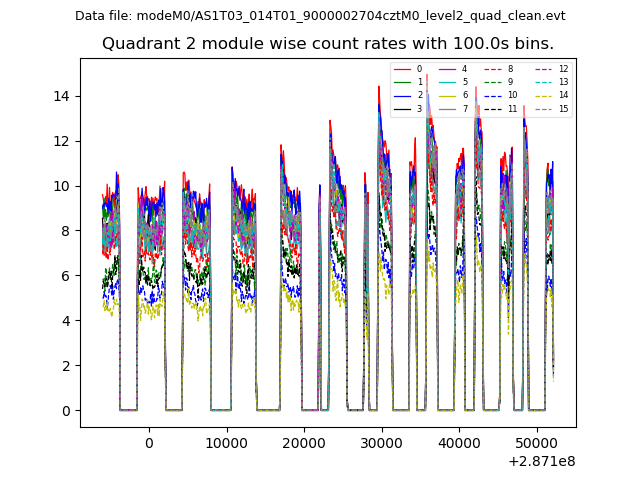
| Module-wise count rates for Quadrant D Data is divided into 100 sec bins |
 |
 |
| Parameter | Plot |
|---|---|
| CZT HV Monitor |  |
| D_VDD |  |
| Temperature 1 |  |
| Veto HV Monitor | 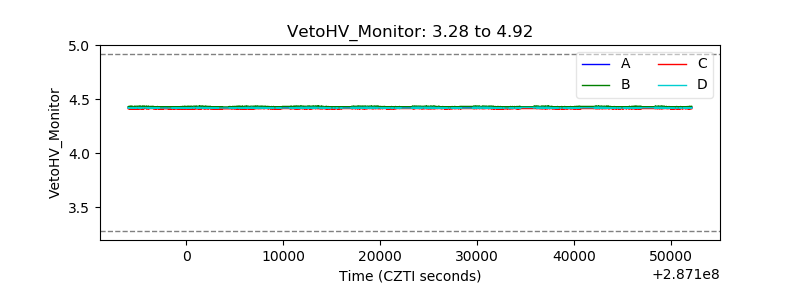 |
| Veto LLD |  |
| Alpha Counter |  |
| _CPM_Rate |  |
| CZT Counter |  |
| +2.5 Volts monitor | 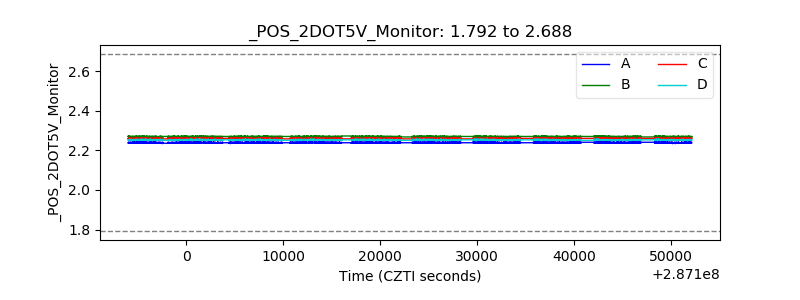 |
| +5 Volts monitor |  |
| _ROLL_ROT |  |
| _Roll_DEC |  |
| _Roll_RA |  |
| Veto Counter |  |