| Param | Original file | Final file |
|---|---|---|
| Filename | modeM0/AS1A05_194T05_9000002702cztM0_level2_bc.evt | modeM0/AS1A05_194T05_9000002702cztM0_level2_quad_clean.evt |
| Size (bytes) | 650,085,120 | 218,926,080 |
| Size | 620.0 MB | 208.8 MB |
| Events in quadrant A | 3,647,834 | 1,386,378 |
| Events in quadrant B | 3,618,023 | 1,404,390 |
| Events in quadrant C | 4,416,091 | 1,352,543 |
| Events in quadrant D | 6,861,795 | 1,335,965 |
| Mode M0 | |||
|---|---|---|---|
| Quadrant | BADHDUFLAG | Total packets | Discarded packets |
| A | 0 | 35622 | 0 |
| B | 0 | 35721 | 0 |
| C | 0 | 38902 | 0 |
| D | 0 | 46928 | 0 |
| Mode SS | |||
|---|---|---|---|
| Quadrant | BADHDUFLAG | Total packets | Discarded packets |
| A | 0 | 342 | 0 |
| B | 0 | 342 | 0 |
| C | 0 | 342 | 0 |
| D | 0 | 342 | 0 |
| Mode M9 | |||
|---|---|---|---|
| Quadrant | BADHDUFLAG | Total packets | Discarded packets |
| A | 0 | 10 | 0 |
| B | 0 | 10 | 0 |
| C | 0 | 10 | 0 |
| D | 0 | 10 | 0 |
| Quadrant | Total seconds | Saturated seconds | Saturation percentage |
|---|---|---|---|
| A | 16702 | 246 | 1.472877% |
| B | 16702 | 305 | 1.826129% |
| C | 16702 | 691 | 4.137229% |
| D | 16702 | 514 | 3.077476% |
Noise dominated data is calculated using 1-second bins in cleaned event files. If a bin has >2000 counts, and if more than 50% of those come from <1% of pixels, then it is considered to be noise-dominated and hence unusable.
| Quadrant | # 1 sec bins | Bins with >0 counts | Bins with >2000 counts | High rate bins dominated by noise | Noise dominated (total time) | Noise dominated (detector-on time) | Marked lightcurve |
|---|---|---|---|---|---|---|---|
| A | 17742 | 16704 | 7 | 7 | 0.04% | 0.04% |  |
| B | 17742 | 16702 | 1 | 1 | 0.01% | 0.01% |  |
| C | 17742 | 16702 | 35 | 35 | 0.20% | 0.21% | 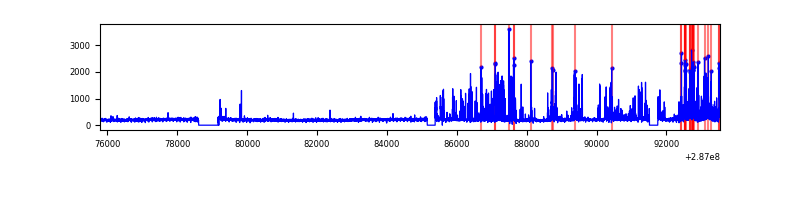 |
| D | 17742 | 16703 | 26 | 26 | 0.15% | 0.16% |  |
Top three noisy pixels from each quadrant. If the there are fewer than three noisy pixels in the level2.evt file, extra rows are filled as -1
| Pixel properties | Quadrant properties | ||||||
|---|---|---|---|---|---|---|---|
| Quadrant | DetID | PixID | Counts | Sigma | Mean | Median | Sigma |
| A | 15 | 174 | 275090 | 1430.92 | 861 | 843 | 191.7 |
| A | 4 | 2 | 61558 | 316.79 | 861 | 843 | 191.7 |
| A | 0 | 226 | 5787 | 25.8 | 861 | 843 | 191.7 |
| B | 7 | 220 | 98543 | 583.24 | 865 | 842 | 167.5 |
| B | 0 | 197 | 38377 | 224.07 | 865 | 842 | 167.5 |
| B | 0 | 229 | 27767 | 160.73 | 865 | 842 | 167.5 |
| C | 4 | 254 | 1137730 | 5817.29 | 826 | 819 | 195.4 |
| C | 3 | 233 | 32551 | 162.36 | 826 | 819 | 195.4 |
| C | 5 | 218 | 25151 | 124.5 | 826 | 819 | 195.4 |
| D | 7 | 238 | 2583704 | 12832.66 | 849 | 817 | 201.3 |
| D | 13 | 187 | 337056 | 1670.55 | 849 | 817 | 201.3 |
| D | 14 | 34 | 108157 | 533.3 | 849 | 817 | 201.3 |
Histogram calculated using DETX and DETY for each event in the final _common_clean file
| Quadrant A |  |
 |
Quadrant B |
|---|---|---|---|
| Quadrant D | 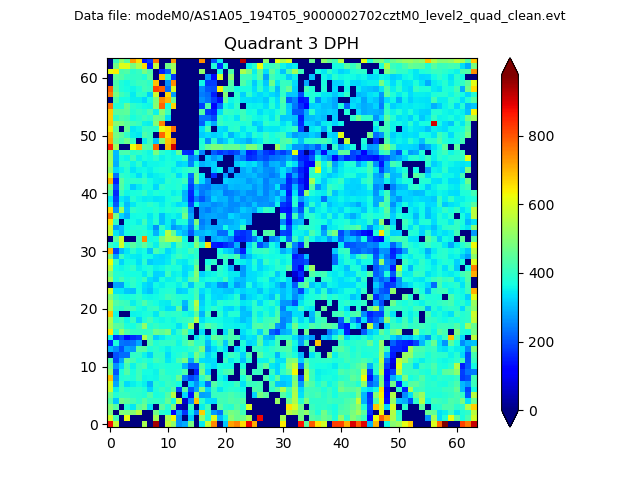 |
 |
Quadrant C |
| Plot type | Count rate plots | Images |
|---|---|---|
| Comparison with Poisson distribution Blue bars denote a histogram of data divided into 1 sec bins. Red curve is a Poisson curve with rate = median count rate of data. |
 |
 |
| Quadrant-wise count rates Data is divided into 100 sec bins |
 |
|
| Module-wise count rates for Quadrant A Data is divided into 100 sec bins |
 |
 |
| Module-wise count rates for Quadrant B Data is divided into 100 sec bins |
 |
 |
| Module-wise count rates for Quadrant C Data is divided into 100 sec bins |
 |
 |
| Module-wise count rates for Quadrant D Data is divided into 100 sec bins |
 |
 |
| Parameter | Plot |
|---|---|
| CZT HV Monitor |  |
| D_VDD |  |
| Temperature 1 |  |
| Veto HV Monitor |  |
| Veto LLD |  |
| Alpha Counter | 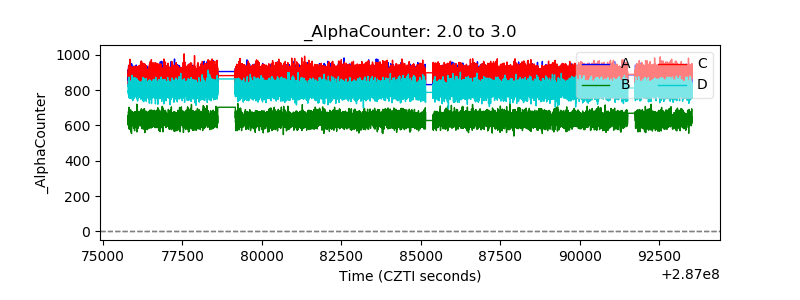 |
| _CPM_Rate |  |
| CZT Counter |  |
| +2.5 Volts monitor |  |
| +5 Volts monitor |  |
| _ROLL_ROT | 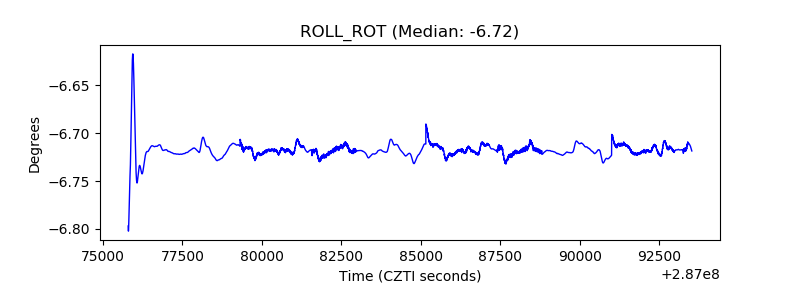 |
| _Roll_DEC |  |
| _Roll_RA |  |
| Veto Counter |  |