| Param | Original file | Final file |
|---|---|---|
| Filename | modeM0/AS1A05_103T01_9000002700cztM0_level2_bc.evt | modeM0/AS1A05_103T01_9000002700cztM0_level2_quad_clean.evt |
| Size (bytes) | 740,329,920 | 233,795,520 |
| Size | 706.0 MB | 223.0 MB |
| Events in quadrant A | 4,468,091 | 1,475,258 |
| Events in quadrant B | 4,407,395 | 1,491,520 |
| Events in quadrant C | 4,044,812 | 1,443,253 |
| Events in quadrant D | 8,252,354 | 1,413,741 |
| Mode M9 | |||
|---|---|---|---|
| Quadrant | BADHDUFLAG | Total packets | Discarded packets |
| A | 0 | 50 | 0 |
| B | 0 | 50 | 0 |
| C | 0 | 50 | 0 |
| D | 0 | 50 | 0 |
| Mode M0 | |||
|---|---|---|---|
| Quadrant | BADHDUFLAG | Total packets | Discarded packets |
| A | 0 | 40256 | 0 |
| B | 0 | 40183 | 0 |
| C | 0 | 39211 | 0 |
| D | 0 | 54597 | 0 |
| Mode SS | |||
|---|---|---|---|
| Quadrant | BADHDUFLAG | Total packets | Discarded packets |
| A | 0 | 370 | 0 |
| B | 0 | 370 | 0 |
| C | 0 | 370 | 0 |
| D | 0 | 370 | 0 |
| Quadrant | Total seconds | Saturated seconds | Saturation percentage |
|---|---|---|---|
| A | 18249 | 387 | 2.120664% |
| B | 18249 | 357 | 1.956272% |
| C | 18249 | 374 | 2.049427% |
| D | 18249 | 1113 | 6.098964% |
Noise dominated data is calculated using 1-second bins in cleaned event files. If a bin has >2000 counts, and if more than 50% of those come from <1% of pixels, then it is considered to be noise-dominated and hence unusable.
| Quadrant | # 1 sec bins | Bins with >0 counts | Bins with >2000 counts | High rate bins dominated by noise | Noise dominated (total time) | Noise dominated (detector-on time) | Marked lightcurve |
|---|---|---|---|---|---|---|---|
| A | 23174 | 18249 | 17 | 17 | 0.07% | 0.09% |  |
| B | 23174 | 18251 | 1 | 1 | 0.00% | 0.01% |  |
| C | 23174 | 18250 | 0 | 0 | 0.00% | 0.00% |  |
| D | 23174 | 18249 | 55 | 55 | 0.24% | 0.30% |  |
Top three noisy pixels from each quadrant. If the there are fewer than three noisy pixels in the level2.evt file, extra rows are filled as -1
| Pixel properties | Quadrant properties | ||||||
|---|---|---|---|---|---|---|---|
| Quadrant | DetID | PixID | Counts | Sigma | Mean | Median | Sigma |
| A | 15 | 174 | 244934 | 1052.06 | 1079 | 1059 | 231.8 |
| A | 4 | 2 | 87836 | 374.35 | 1079 | 1059 | 231.8 |
| A | 0 | 226 | 7156 | 26.3 | 1079 | 1059 | 231.8 |
| B | 7 | 220 | 121762 | 608.27 | 1079 | 1056 | 198.4 |
| B | 0 | 189 | 34301 | 167.53 | 1079 | 1056 | 198.4 |
| B | 0 | 229 | 32152 | 156.7 | 1079 | 1056 | 198.4 |
| C | 3 | 233 | 23019 | 91.91 | 1037 | 1034 | 239.2 |
| C | 5 | 218 | 18270 | 72.06 | 1037 | 1034 | 239.2 |
| C | 0 | 207 | 9299 | 34.55 | 1037 | 1034 | 239.2 |
| D | 7 | 238 | 2233908 | 9084.53 | 1053 | 1015 | 245.8 |
| D | 13 | 187 | 968666 | 3936.89 | 1053 | 1015 | 245.8 |
| D | 12 | 110 | 354222 | 1437.02 | 1053 | 1015 | 245.8 |
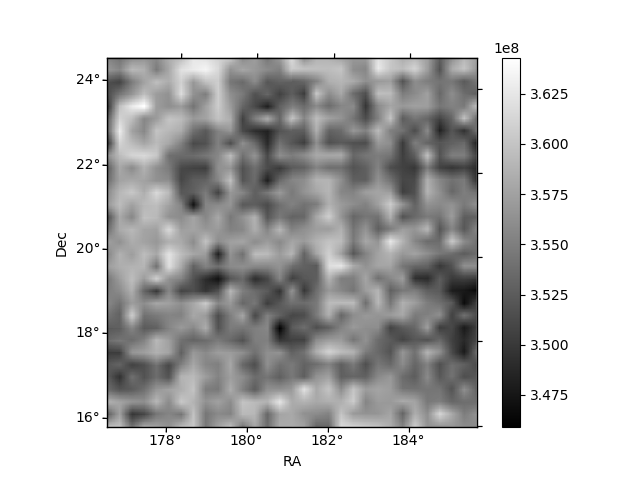
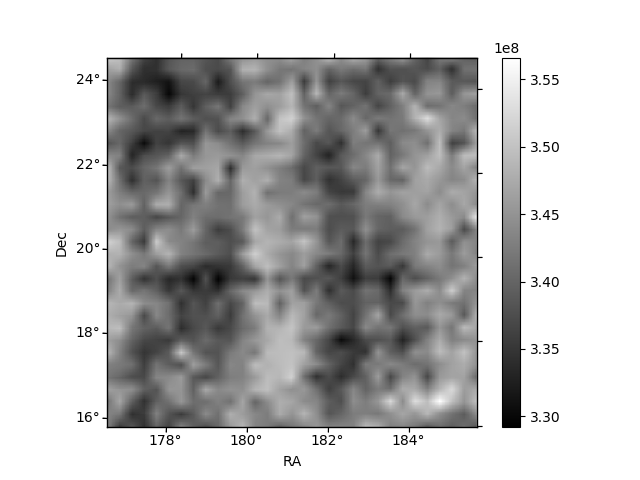
Histogram calculated using DETX and DETY for each event in the final _common_clean file
| Quadrant A |  |
 |
Quadrant B |
|---|---|---|---|
| Quadrant D |  |
 |
Quadrant C |
| Plot type | Count rate plots | Images |
|---|---|---|
| Comparison with Poisson distribution Blue bars denote a histogram of data divided into 1 sec bins. Red curve is a Poisson curve with rate = median count rate of data. |
 |
 |
| Quadrant-wise count rates Data is divided into 100 sec bins |
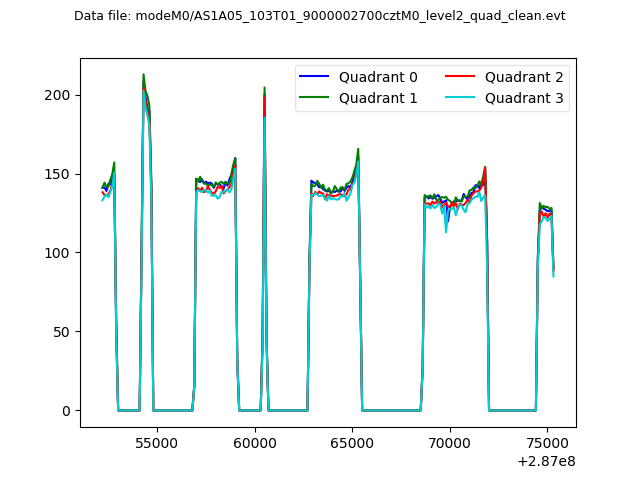 |
|
| Module-wise count rates for Quadrant A Data is divided into 100 sec bins |
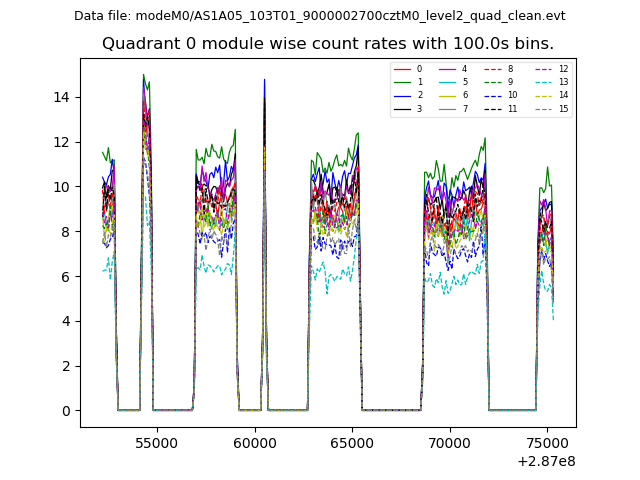 |
 |
| Module-wise count rates for Quadrant B Data is divided into 100 sec bins |
 |
 |
| Module-wise count rates for Quadrant C Data is divided into 100 sec bins |
 |
 |
| Module-wise count rates for Quadrant D Data is divided into 100 sec bins |
 |
 |
| Parameter | Plot |
|---|---|
| CZT HV Monitor |  |
| D_VDD |  |
| Temperature 1 |  |
| Veto HV Monitor |  |
| Veto LLD |  |
| Alpha Counter | 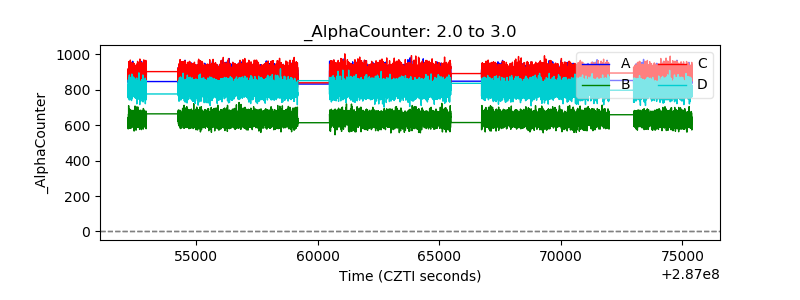 |
| _CPM_Rate |  |
| CZT Counter |  |
| +2.5 Volts monitor |  |
| +5 Volts monitor |  |
| _ROLL_ROT |  |
| _Roll_DEC |  |
| _Roll_RA |  |
| Veto Counter |  |