| Param | Original file | Final file |
|---|---|---|
| Filename | modeM0/AS1T03_035T01_9000002696cztM0_level2_bc.evt | modeM0/AS1T03_035T01_9000002696cztM0_level2_quad_clean.evt |
| Size (bytes) | 543,614,400 | 185,091,840 |
| Size | 518.4 MB | 176.5 MB |
| Events in quadrant A | 3,206,884 | 1,153,717 |
| Events in quadrant B | 3,189,562 | 1,184,544 |
| Events in quadrant C | 2,884,852 | 1,147,419 |
| Events in quadrant D | 6,183,101 | 1,115,087 |
| Mode M9 | |||
|---|---|---|---|
| Quadrant | BADHDUFLAG | Total packets | Discarded packets |
| A | 0 | 14 | 0 |
| B | 0 | 14 | 0 |
| C | 0 | 14 | 0 |
| D | 0 | 14 | 0 |
| Mode M0 | |||
|---|---|---|---|
| Quadrant | BADHDUFLAG | Total packets | Discarded packets |
| A | 0 | 31547 | 0 |
| B | 0 | 31168 | 0 |
| C | 0 | 30338 | 0 |
| D | 0 | 41028 | 0 |
| Mode SS | |||
|---|---|---|---|
| Quadrant | BADHDUFLAG | Total packets | Discarded packets |
| A | 0 | 296 | 0 |
| B | 0 | 296 | 0 |
| C | 0 | 296 | 0 |
| D | 0 | 296 | 0 |
| Quadrant | Total seconds | Saturated seconds | Saturation percentage |
|---|---|---|---|
| A | 14566 | 300 | 2.059591% |
| B | 14566 | 303 | 2.080187% |
| C | 14566 | 295 | 2.025264% |
| D | 14566 | 484 | 3.322807% |
Noise dominated data is calculated using 1-second bins in cleaned event files. If a bin has >2000 counts, and if more than 50% of those come from <1% of pixels, then it is considered to be noise-dominated and hence unusable.
| Quadrant | # 1 sec bins | Bins with >0 counts | Bins with >2000 counts | High rate bins dominated by noise | Noise dominated (total time) | Noise dominated (detector-on time) | Marked lightcurve |
|---|---|---|---|---|---|---|---|
| A | 15896 | 14566 | 20 | 20 | 0.13% | 0.14% |  |
| B | 15896 | 14566 | 2 | 2 | 0.01% | 0.01% |  |
| C | 15896 | 14566 | 0 | 0 | 0.00% | 0.00% | 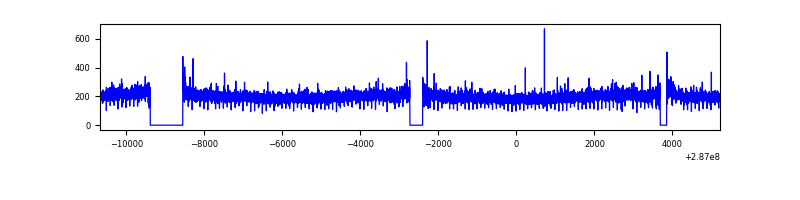 |
| D | 15896 | 14566 | 57 | 57 | 0.36% | 0.39% |  |
Top three noisy pixels from each quadrant. If the there are fewer than three noisy pixels in the level2.evt file, extra rows are filled as -1
| Pixel properties | Quadrant properties | ||||||
|---|---|---|---|---|---|---|---|
| Quadrant | DetID | PixID | Counts | Sigma | Mean | Median | Sigma |
| A | 15 | 174 | 220441 | 1303.23 | 761 | 745 | 168.6 |
| A | 4 | 2 | 51828 | 303.02 | 761 | 745 | 168.6 |
| A | 0 | 8 | 7065 | 37.49 | 761 | 745 | 168.6 |
| B | 0 | 189 | 42186 | 275.04 | 772 | 752 | 150.6 |
| B | 6 | 36 | 41956 | 273.51 | 772 | 752 | 150.6 |
| B | 7 | 220 | 41144 | 268.12 | 772 | 752 | 150.6 |
| C | 3 | 233 | 25814 | 142.81 | 737 | 729 | 175.7 |
| C | 5 | 218 | 19678 | 107.88 | 737 | 729 | 175.7 |
| C | 0 | 207 | 5190 | 25.4 | 737 | 729 | 175.7 |
| D | 7 | 238 | 2652150 | 14833.0 | 751 | 720 | 178.8 |
| D | 12 | 110 | 209018 | 1165.29 | 751 | 720 | 178.8 |
| D | 11 | 176 | 171919 | 957.75 | 751 | 720 | 178.8 |
Histogram calculated using DETX and DETY for each event in the final _common_clean file
| Quadrant A |  |
 |
Quadrant B |
|---|---|---|---|
| Quadrant D | 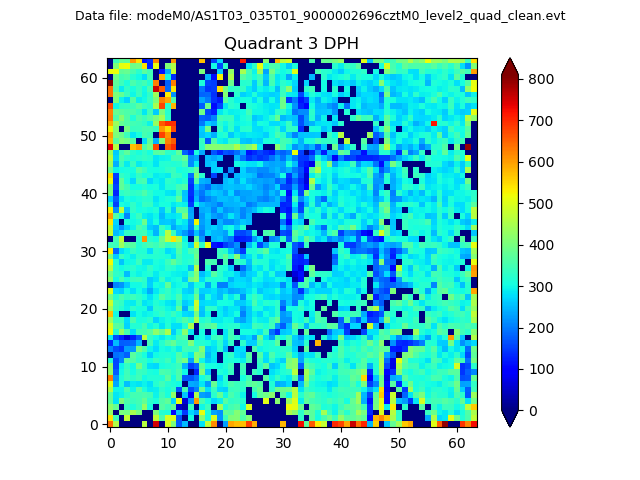 |
 |
Quadrant C |
| Plot type | Count rate plots | Images |
|---|---|---|
| Comparison with Poisson distribution Blue bars denote a histogram of data divided into 1 sec bins. Red curve is a Poisson curve with rate = median count rate of data. |
 |
 |
| Quadrant-wise count rates Data is divided into 100 sec bins |
 |
|
| Module-wise count rates for Quadrant A Data is divided into 100 sec bins |
 |
 |
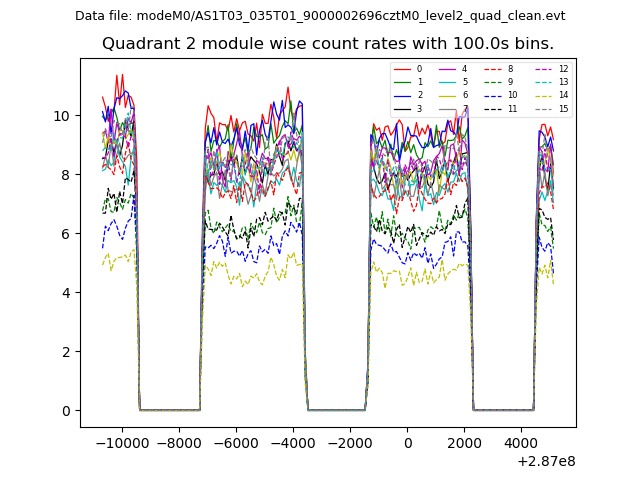
| Module-wise count rates for Quadrant B Data is divided into 100 sec bins |
 |
 |
| Module-wise count rates for Quadrant C Data is divided into 100 sec bins |
 |
 |
| Module-wise count rates for Quadrant D Data is divided into 100 sec bins |
 |
 |
| Parameter | Plot |
|---|---|
| CZT HV Monitor |  |
| D_VDD | 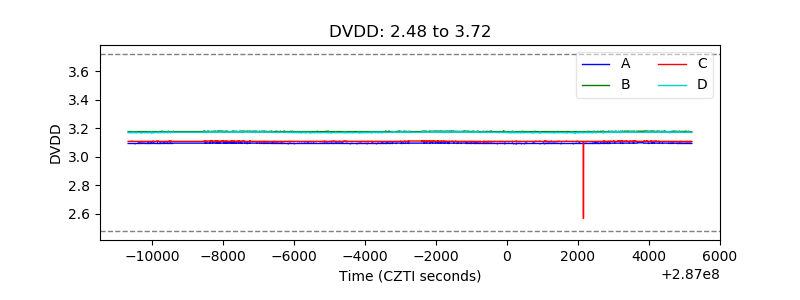 |
| Temperature 1 |  |
| Veto HV Monitor | 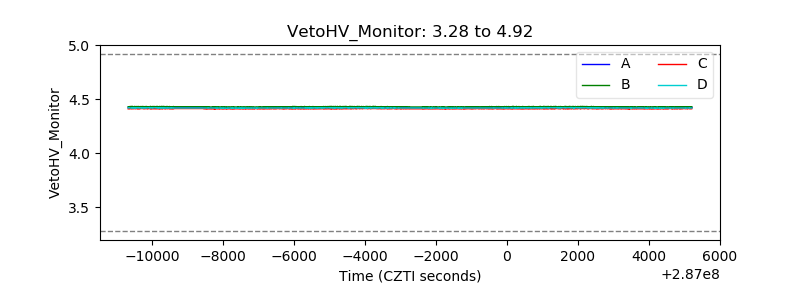 |
| Veto LLD |  |
| Alpha Counter |  |
| _CPM_Rate | 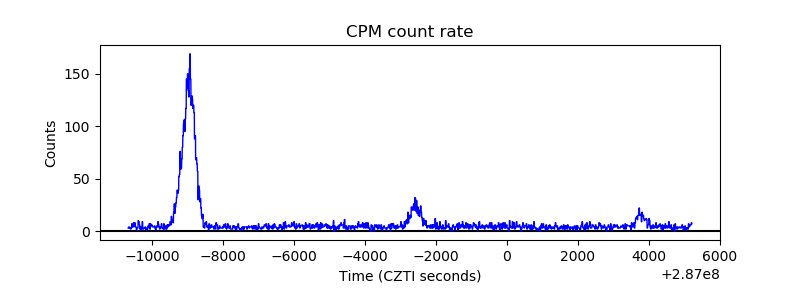 |
| CZT Counter |  |
| +2.5 Volts monitor |  |
| +5 Volts monitor |  |
| _ROLL_ROT |  |
| _Roll_DEC |  |
| _Roll_RA |  |
| Veto Counter |  |