| Param | Original file | Final file |
|---|---|---|
| Filename | modeM0/AS1A05_084T04_9000002694cztM0_level2_bc.evt | modeM0/AS1A05_084T04_9000002694cztM0_level2_quad_clean.evt |
| Size (bytes) | 360,391,680 | 130,654,080 |
| Size | 343.7 MB | 124.6 MB |
| Events in quadrant A | 1,727,658 | 895,128 |
| Events in quadrant B | 1,920,950 | 887,167 |
| Events in quadrant C | 1,655,783 | 845,136 |
| Events in quadrant D | 5,075,007 | 790,267 |
| Mode SS | |||
|---|---|---|---|
| Quadrant | BADHDUFLAG | Total packets | Discarded packets |
| A | 0 | 156 | 0 |
| B | 0 | 156 | 0 |
| C | 0 | 156 | 0 |
| D | 0 | 156 | 0 |
| Mode M0 | |||
|---|---|---|---|
| Quadrant | BADHDUFLAG | Total packets | Discarded packets |
| A | 0 | 16443 | 0 |
| B | 0 | 17197 | 0 |
| C | 0 | 16405 | 0 |
| D | 0 | 27651 | 0 |
| Mode M9 | |||
|---|---|---|---|
| Quadrant | BADHDUFLAG | Total packets | Discarded packets |
| A | 0 | 22 | 0 |
| B | 0 | 22 | 0 |
| C | 0 | 22 | 0 |
| D | 0 | 22 | 0 |
| Quadrant | Total seconds | Saturated seconds | Saturation percentage |
|---|---|---|---|
| A | 7762 | 81 | 1.043545% |
| B | 7762 | 112 | 1.442927% |
| C | 7762 | 88 | 1.133728% |
| D | 7762 | 666 | 8.580263% |
Noise dominated data is calculated using 1-second bins in cleaned event files. If a bin has >2000 counts, and if more than 50% of those come from <1% of pixels, then it is considered to be noise-dominated and hence unusable.
| Quadrant | # 1 sec bins | Bins with >0 counts | Bins with >2000 counts | High rate bins dominated by noise | Noise dominated (total time) | Noise dominated (detector-on time) | Marked lightcurve |
|---|---|---|---|---|---|---|---|
| A | 8911 | 7761 | 0 | 0 | 0.00% | 0.00% | 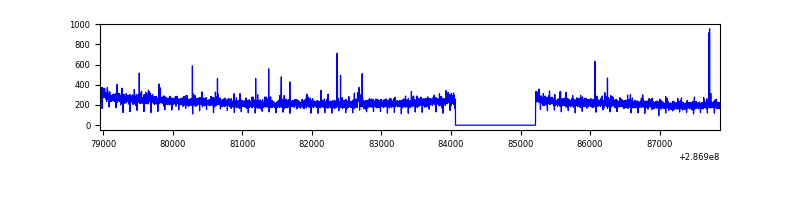 |
| B | 8911 | 7761 | 3 | 3 | 0.03% | 0.04% |  |
| C | 8911 | 7761 | 0 | 0 | 0.00% | 0.00% |  |
| D | 8912 | 7762 | 293 | 293 | 3.29% | 3.77% |  |
Top three noisy pixels from each quadrant. If the there are fewer than three noisy pixels in the level2.evt file, extra rows are filled as -1
| Pixel properties | Quadrant properties | ||||||
|---|---|---|---|---|---|---|---|
| Quadrant | DetID | PixID | Counts | Sigma | Mean | Median | Sigma |
| A | 15 | 174 | 10383 | 102.88 | 444 | 437 | 96.7 |
| A | 0 | 8 | 5335 | 50.66 | 444 | 437 | 96.7 |
| A | 4 | 2 | 4326 | 40.23 | 444 | 437 | 96.7 |
| B | 7 | 220 | 68222 | 811.4 | 441 | 433 | 83.5 |
| B | 0 | 197 | 37605 | 444.93 | 441 | 433 | 83.5 |
| B | 5 | 172 | 30808 | 363.57 | 441 | 433 | 83.5 |
| C | 3 | 233 | 37825 | 376.99 | 415 | 413 | 99.2 |
| C | 5 | 218 | 11748 | 114.22 | 415 | 413 | 99.2 |
| C | 0 | 207 | 4888 | 45.09 | 415 | 413 | 99.2 |
| D | 7 | 238 | 1737407 | 17732.09 | 415 | 402 | 98.0 |
| D | 12 | 110 | 1164057 | 11879.09 | 415 | 402 | 98.0 |
| D | 11 | 176 | 244664 | 2493.53 | 415 | 402 | 98.0 |
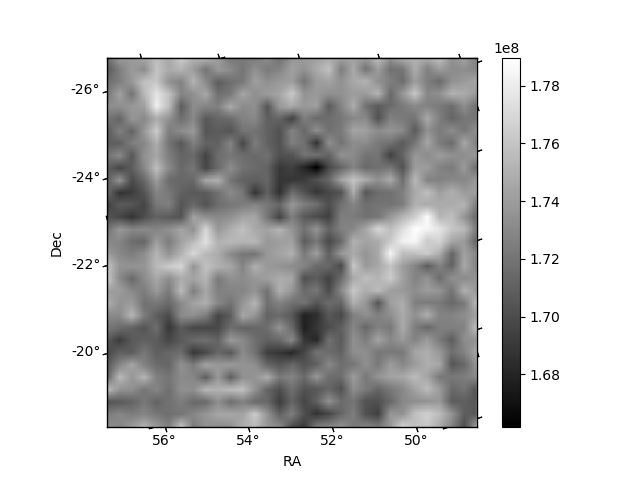
Histogram calculated using DETX and DETY for each event in the final _common_clean file
| Quadrant A |  |
 |
Quadrant B |
|---|---|---|---|
| Quadrant D |  |
 |
Quadrant C |
| Plot type | Count rate plots | Images |
|---|---|---|
| Comparison with Poisson distribution Blue bars denote a histogram of data divided into 1 sec bins. Red curve is a Poisson curve with rate = median count rate of data. |
 |
 |
| Quadrant-wise count rates Data is divided into 100 sec bins |
 |
|
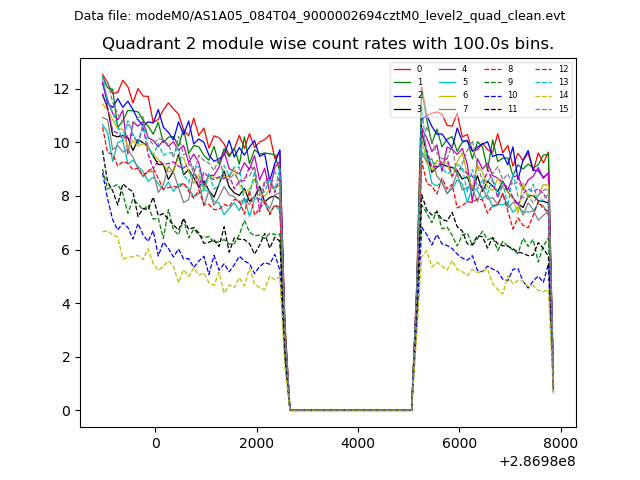
| Module-wise count rates for Quadrant A Data is divided into 100 sec bins |
 |
 |
| Module-wise count rates for Quadrant B Data is divided into 100 sec bins |
 |
 |
| Module-wise count rates for Quadrant C Data is divided into 100 sec bins |
 |
 |
| Module-wise count rates for Quadrant D Data is divided into 100 sec bins |
 |
 |
| Parameter | Plot |
|---|---|
| CZT HV Monitor |  |
| D_VDD | 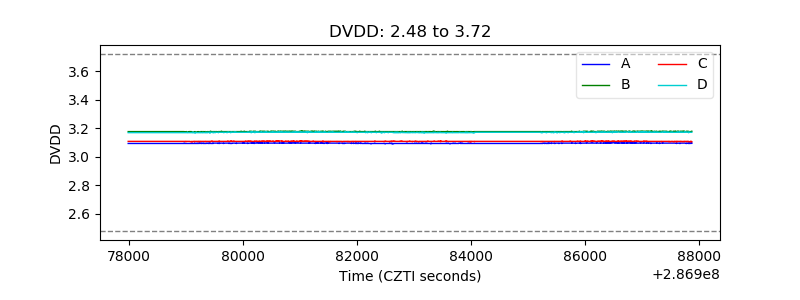 |
| Temperature 1 | 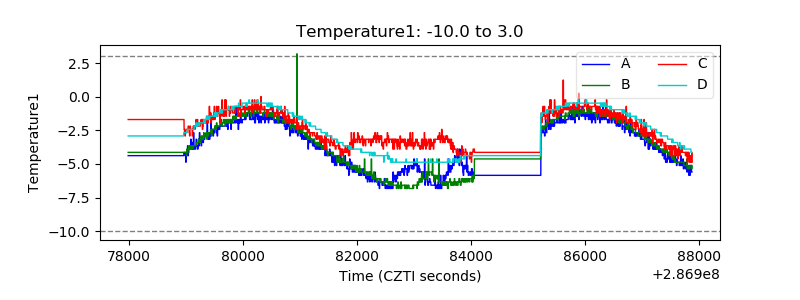 |
| Veto HV Monitor |  |
| Veto LLD |  |
| Alpha Counter | 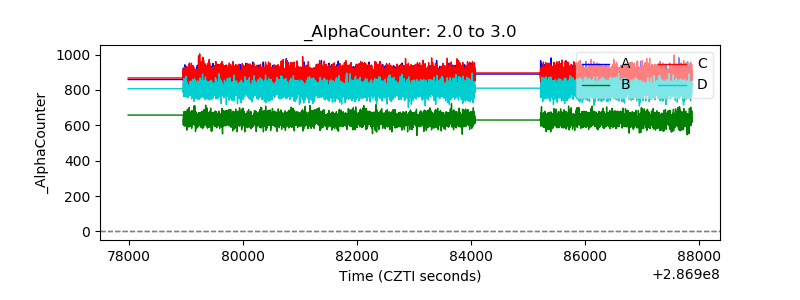 |
| _CPM_Rate | 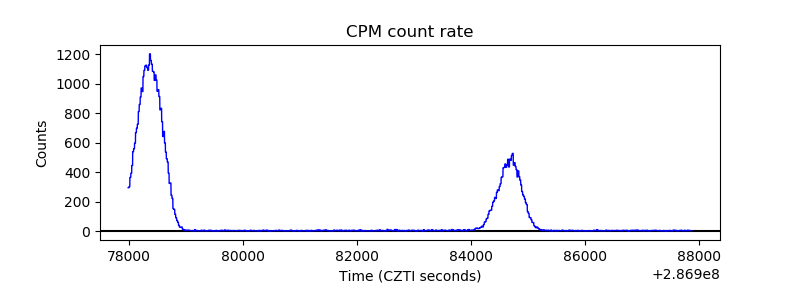 |
| CZT Counter | 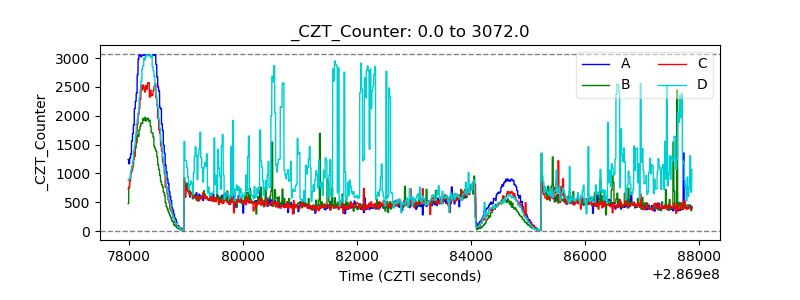 |
| +2.5 Volts monitor |  |
| +5 Volts monitor |  |
| _ROLL_ROT |  |
| _Roll_DEC |  |
| _Roll_RA |  |
| Veto Counter | 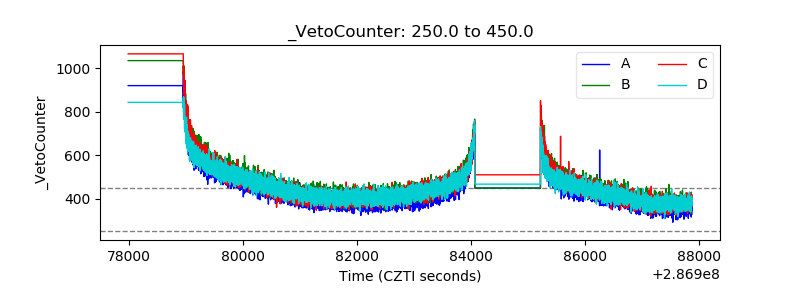 |