| Param | Original file | Final file |
|---|---|---|
| Filename | modeM0/AS1A05_082T08_9000002698cztM0_level2_bc.evt | modeM0/AS1A05_082T08_9000002698cztM0_level2_quad_clean.evt |
| Size (bytes) | 1,530,097,920 | 483,361,920 |
| Size | 1.4 GB | 461.0 MB |
| Events in quadrant A | 8,997,275 | 3,020,345 |
| Events in quadrant B | 9,258,396 | 3,060,012 |
| Events in quadrant C | 8,344,469 | 2,950,040 |
| Events in quadrant D | 16,990,913 | 2,843,520 |
| Mode M0 | |||
|---|---|---|---|
| Quadrant | BADHDUFLAG | Total packets | Discarded packets |
| A | 0 | 85731 | 0 |
| B | 0 | 86752 | 0 |
| C | 0 | 84119 | 0 |
| D | 0 | 113695 | 0 |
| Mode SS | |||
|---|---|---|---|
| Quadrant | BADHDUFLAG | Total packets | Discarded packets |
| A | 0 | 822 | 0 |
| B | 0 | 822 | 0 |
| C | 0 | 822 | 0 |
| D | 0 | 822 | 0 |
| Mode M9 | |||
|---|---|---|---|
| Quadrant | BADHDUFLAG | Total packets | Discarded packets |
| A | 0 | 58 | 0 |
| B | 0 | 58 | 0 |
| C | 0 | 58 | 0 |
| D | 0 | 58 | 0 |
| Quadrant | Total seconds | Saturated seconds | Saturation percentage |
|---|---|---|---|
| A | 40285 | 415 | 1.030160% |
| B | 40283 | 449 | 1.114614% |
| C | 40279 | 483 | 1.199136% |
| D | 40280 | 2134 | 5.297915% |
Noise dominated data is calculated using 1-second bins in cleaned event files. If a bin has >2000 counts, and if more than 50% of those come from <1% of pixels, then it is considered to be noise-dominated and hence unusable.
| Quadrant | # 1 sec bins | Bins with >0 counts | Bins with >2000 counts | High rate bins dominated by noise | Noise dominated (total time) | Noise dominated (detector-on time) | Marked lightcurve |
|---|---|---|---|---|---|---|---|
| A | 46161 | 40298 | 7 | 7 | 0.02% | 0.02% |  |
| B | 46161 | 40297 | 12 | 12 | 0.03% | 0.03% |  |
| C | 46161 | 40296 | 2 | 2 | 0.00% | 0.00% | 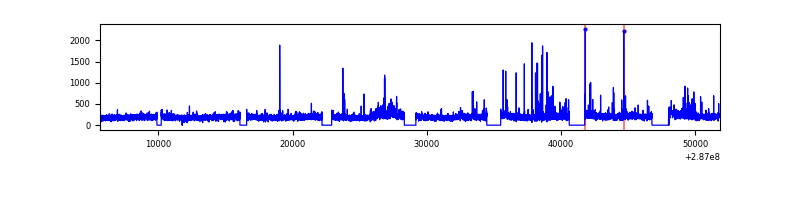 |
| D | 46161 | 40296 | 487 | 487 | 1.06% | 1.21% |  |
Top three noisy pixels from each quadrant. If the there are fewer than three noisy pixels in the level2.evt file, extra rows are filled as -1
| Pixel properties | Quadrant properties | ||||||
|---|---|---|---|---|---|---|---|
| Quadrant | DetID | PixID | Counts | Sigma | Mean | Median | Sigma |
| A | 15 | 174 | 728321 | 1585.12 | 2125 | 2085 | 458.2 |
| A | 4 | 2 | 74424 | 157.89 | 2125 | 2085 | 458.2 |
| A | 15 | 9 | 18090 | 34.93 | 2125 | 2085 | 458.2 |
| B | 4 | 171 | 301576 | 740.33 | 2136 | 2082 | 404.5 |
| B | 7 | 220 | 189150 | 462.42 | 2136 | 2082 | 404.5 |
| B | 5 | 143 | 186114 | 454.91 | 2136 | 2082 | 404.5 |
| C | 3 | 233 | 255144 | 529.88 | 2038 | 2023 | 477.7 |
| C | 0 | 207 | 220998 | 458.4 | 2038 | 2023 | 477.7 |
| C | 9 | 160 | 17876 | 33.19 | 2038 | 2023 | 477.7 |
| D | 7 | 238 | 3293721 | 6841.66 | 2056 | 1981 | 481.1 |
| D | 11 | 176 | 2125869 | 4414.36 | 2056 | 1981 | 481.1 |
| D | 12 | 110 | 1820080 | 3778.79 | 2056 | 1981 | 481.1 |
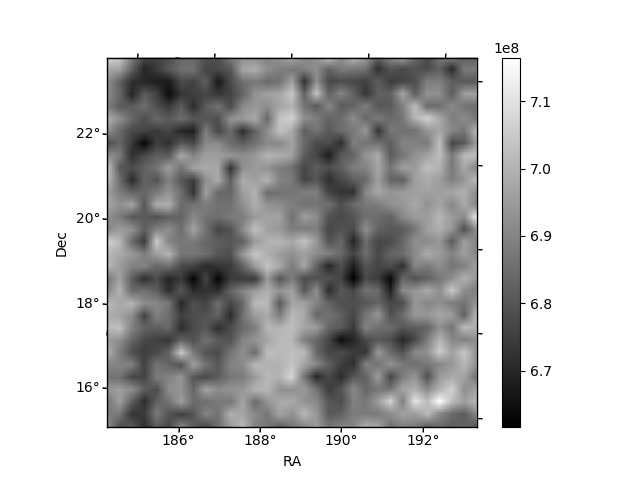
Histogram calculated using DETX and DETY for each event in the final _common_clean file
| Quadrant A |  |
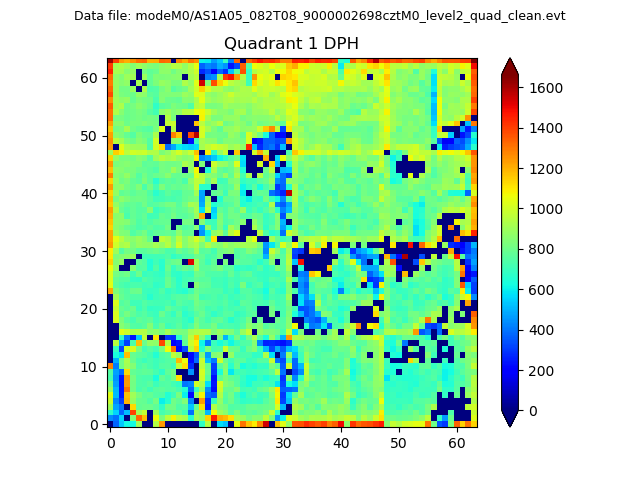 |
Quadrant B |
|---|---|---|---|
| Quadrant D |  |
 |
Quadrant C |
| Plot type | Count rate plots | Images |
|---|---|---|
| Comparison with Poisson distribution Blue bars denote a histogram of data divided into 1 sec bins. Red curve is a Poisson curve with rate = median count rate of data. |
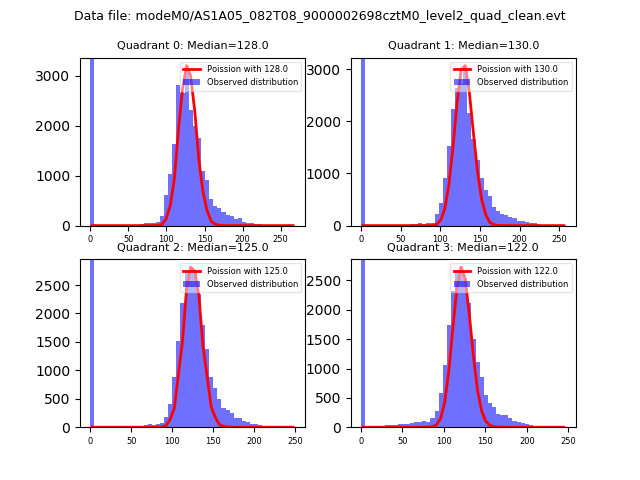 |
 |
| Quadrant-wise count rates Data is divided into 100 sec bins |
 |
|
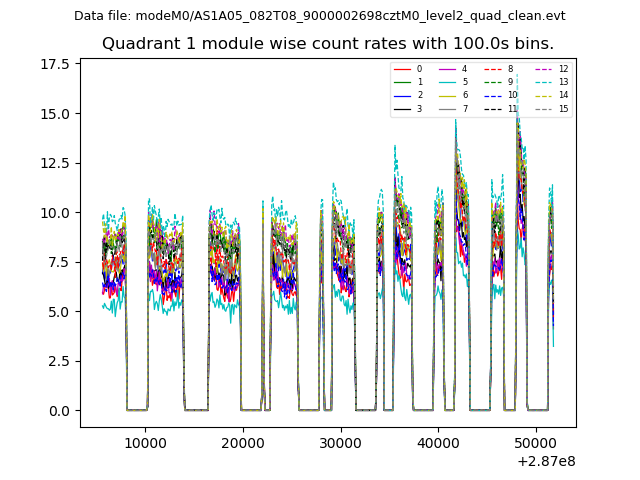
| Module-wise count rates for Quadrant A Data is divided into 100 sec bins |
 |
 |
| Module-wise count rates for Quadrant B Data is divided into 100 sec bins |
 |
 |
| Module-wise count rates for Quadrant C Data is divided into 100 sec bins |
 |
 |
| Module-wise count rates for Quadrant D Data is divided into 100 sec bins |
 |
 |
| Parameter | Plot |
|---|---|
| CZT HV Monitor |  |
| D_VDD |  |
| Temperature 1 |  |
| Veto HV Monitor |  |
| Veto LLD |  |
| Alpha Counter |  |
| _CPM_Rate | 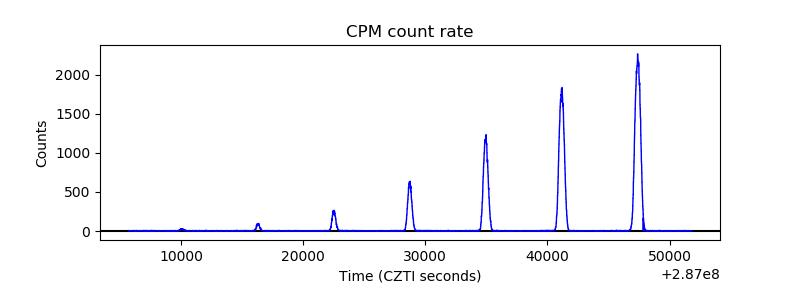 |
| CZT Counter |  |
| +2.5 Volts monitor | 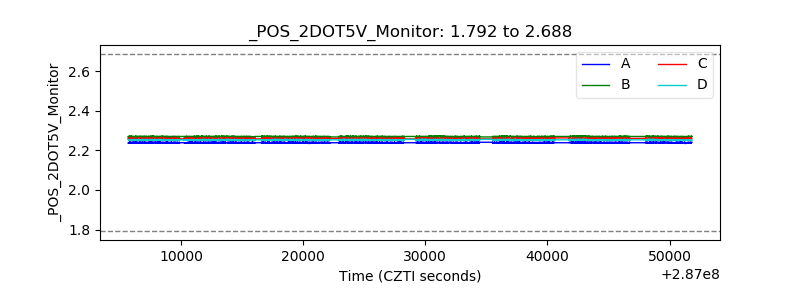 |
| +5 Volts monitor | 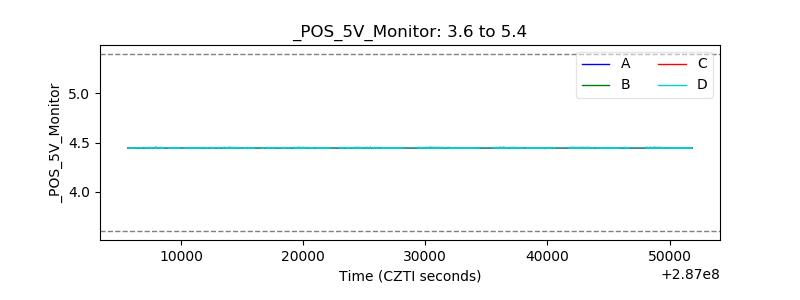 |
| _ROLL_ROT |  |
| _Roll_DEC | 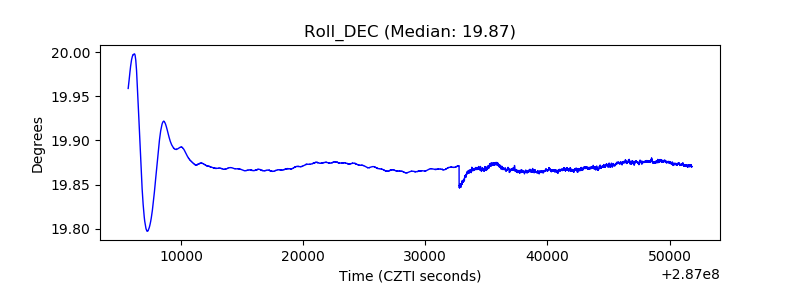 |
| _Roll_RA |  |
| Veto Counter |  |