| Param | Original file | Final file |
|---|---|---|
| Filename | modeM0/AS1A05_186T01_9000002692cztM0_level2_bc.evt | modeM0/AS1A05_186T01_9000002692cztM0_level2_quad_clean.evt |
| Size (bytes) | 1,864,103,040 | 626,938,560 |
| Size | 1.7 GB | 597.9 MB |
| Events in quadrant A | 10,684,886 | 4,064,264 |
| Events in quadrant B | 11,419,039 | 4,102,039 |
| Events in quadrant C | 10,236,143 | 3,866,002 |
| Events in quadrant D | 20,728,271 | 3,548,229 |
| Mode SS | |||
|---|---|---|---|
| Quadrant | BADHDUFLAG | Total packets | Discarded packets |
| A | 0 | 1014 | 0 |
| B | 0 | 1014 | 0 |
| C | 0 | 1014 | 0 |
| D | 0 | 1014 | 0 |
| Mode M0 | |||
|---|---|---|---|
| Quadrant | BADHDUFLAG | Total packets | Discarded packets |
| A | 0 | 103961 | 0 |
| B | 0 | 106622 | 0 |
| C | 0 | 103537 | 0 |
| D | 0 | 141896 | 0 |
| Mode M9 | |||
|---|---|---|---|
| Quadrant | BADHDUFLAG | Total packets | Discarded packets |
| A | 0 | 79 | 0 |
| B | 0 | 79 | 0 |
| C | 0 | 79 | 0 |
| D | 0 | 79 | 0 |
| Quadrant | Total seconds | Saturated seconds | Saturation percentage |
|---|---|---|---|
| A | 49652 | 386 | 0.777411% |
| B | 49652 | 531 | 1.069443% |
| C | 49652 | 550 | 1.107710% |
| D | 49652 | 3058 | 6.158866% |
Noise dominated data is calculated using 1-second bins in cleaned event files. If a bin has >2000 counts, and if more than 50% of those come from <1% of pixels, then it is considered to be noise-dominated and hence unusable.
| Quadrant | # 1 sec bins | Bins with >0 counts | Bins with >2000 counts | High rate bins dominated by noise | Noise dominated (total time) | Noise dominated (detector-on time) | Marked lightcurve |
|---|---|---|---|---|---|---|---|
| A | 57712 | 49653 | 3 | 3 | 0.01% | 0.01% |  |
| B | 57712 | 49652 | 3 | 3 | 0.01% | 0.01% |  |
| C | 57712 | 49650 | 0 | 0 | 0.00% | 0.00% |  |
| D | 57712 | 49652 | 513 | 513 | 0.89% | 1.03% |  |
Top three noisy pixels from each quadrant. If the there are fewer than three noisy pixels in the level2.evt file, extra rows are filled as -1
| Pixel properties | Quadrant properties | ||||||
|---|---|---|---|---|---|---|---|
| Quadrant | DetID | PixID | Counts | Sigma | Mean | Median | Sigma |
| A | 15 | 174 | 123178 | 201.57 | 2730 | 2684 | 597.8 |
| A | 4 | 2 | 93695 | 152.25 | 2730 | 2684 | 597.8 |
| A | 0 | 226 | 17884 | 25.43 | 2730 | 2684 | 597.8 |
| B | 0 | 189 | 194475 | 369.22 | 2754 | 2687 | 519.4 |
| B | 7 | 220 | 189947 | 360.51 | 2754 | 2687 | 519.4 |
| B | 4 | 216 | 80700 | 150.19 | 2754 | 2687 | 519.4 |
| C | 0 | 207 | 92397 | 149.97 | 2585 | 2579 | 598.9 |
| C | 9 | 160 | 63172 | 101.17 | 2585 | 2579 | 598.9 |
| C | 9 | 176 | 50040 | 79.24 | 2585 | 2579 | 598.9 |
| D | 7 | 238 | 6153271 | 10294.37 | 2561 | 2469 | 597.5 |
| D | 11 | 176 | 2735691 | 4574.49 | 2561 | 2469 | 597.5 |
| D | 10 | 70 | 449865 | 748.79 | 2561 | 2469 | 597.5 |
Histogram calculated using DETX and DETY for each event in the final _common_clean file
| Quadrant A |  |
 |
Quadrant B |
|---|---|---|---|
| Quadrant D |  |
 |
Quadrant C |
| Plot type | Count rate plots | Images |
|---|---|---|
| Comparison with Poisson distribution Blue bars denote a histogram of data divided into 1 sec bins. Red curve is a Poisson curve with rate = median count rate of data. |
 |
 |
| Quadrant-wise count rates Data is divided into 100 sec bins |
 |
|
| Module-wise count rates for Quadrant A Data is divided into 100 sec bins |
 |
 |
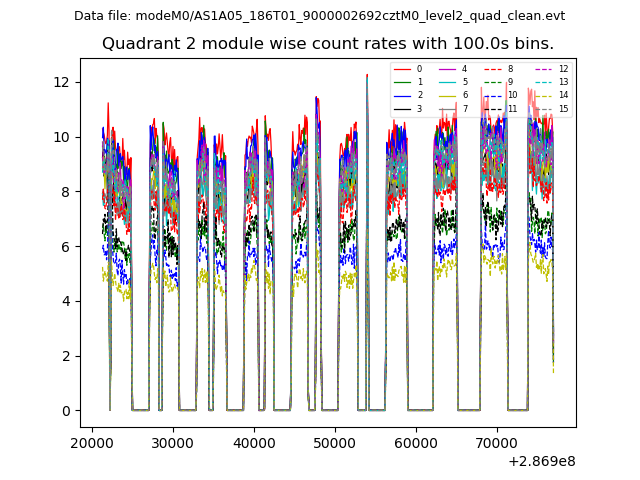
| Module-wise count rates for Quadrant B Data is divided into 100 sec bins |
 |
 |
| Module-wise count rates for Quadrant C Data is divided into 100 sec bins |
 |
 |
| Module-wise count rates for Quadrant D Data is divided into 100 sec bins |
 |
 |
| Parameter | Plot |
|---|---|
| CZT HV Monitor |  |
| D_VDD | 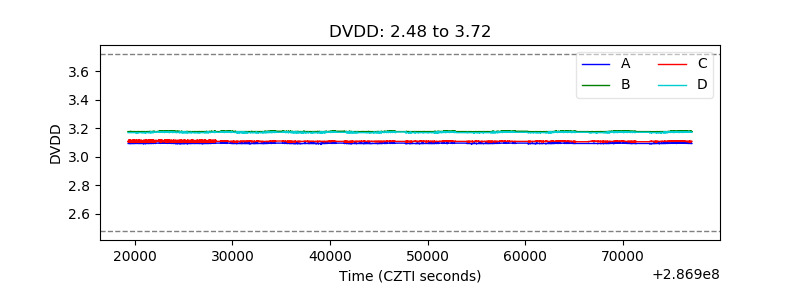 |
| Temperature 1 |  |
| Veto HV Monitor |  |
| Veto LLD |  |
| Alpha Counter | 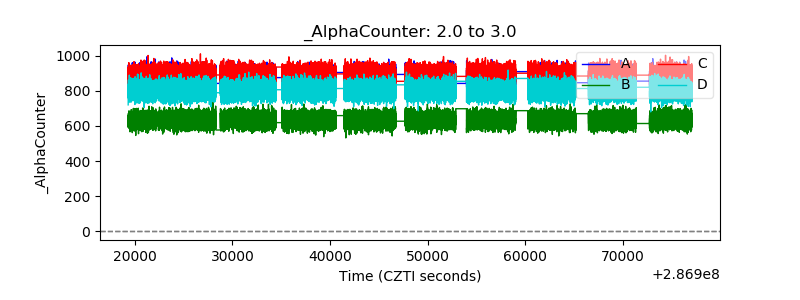 |
| _CPM_Rate |  |
| CZT Counter |  |
| +2.5 Volts monitor | 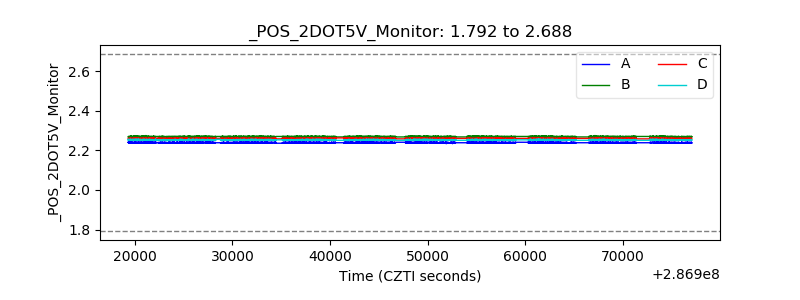 |
| +5 Volts monitor |  |
| _ROLL_ROT |  |
| _Roll_DEC |  |
| _Roll_RA |  |
| Veto Counter |  |