| Param | Original file | Final file |
|---|---|---|
| Filename | modeM0/AS1A05_097T01_9000002690cztM0_level2_bc.evt | modeM0/AS1A05_097T01_9000002690cztM0_level2_quad_clean.evt |
| Size (bytes) | 752,607,360 | 249,485,760 |
| Size | 717.7 MB | 237.9 MB |
| Events in quadrant A | 4,365,538 | 1,542,264 |
| Events in quadrant B | 4,484,207 | 1,588,478 |
| Events in quadrant C | 4,083,267 | 1,556,890 |
| Events in quadrant D | 8,522,404 | 1,522,486 |
| Mode M0 | |||
|---|---|---|---|
| Quadrant | BADHDUFLAG | Total packets | Discarded packets |
| A | 0 | 41838 | 0 |
| B | 0 | 42336 | 0 |
| C | 0 | 41127 | 0 |
| D | 0 | 55878 | 0 |
| Mode SS | |||
|---|---|---|---|
| Quadrant | BADHDUFLAG | Total packets | Discarded packets |
| A | 0 | 400 | 0 |
| B | 0 | 400 | 0 |
| C | 0 | 400 | 0 |
| D | 0 | 400 | 0 |
| Mode M9 | |||
|---|---|---|---|
| Quadrant | BADHDUFLAG | Total packets | Discarded packets |
| A | 0 | 29 | 0 |
| B | 0 | 29 | 0 |
| C | 0 | 29 | 0 |
| D | 0 | 29 | 0 |
| Quadrant | Total seconds | Saturated seconds | Saturation percentage |
|---|---|---|---|
| A | 19536 | 388 | 1.986077% |
| B | 19536 | 451 | 2.308559% |
| C | 19536 | 479 | 2.451884% |
| D | 19536 | 948 | 4.852580% |
Noise dominated data is calculated using 1-second bins in cleaned event files. If a bin has >2000 counts, and if more than 50% of those come from <1% of pixels, then it is considered to be noise-dominated and hence unusable.
| Quadrant | # 1 sec bins | Bins with >0 counts | Bins with >2000 counts | High rate bins dominated by noise | Noise dominated (total time) | Noise dominated (detector-on time) | Marked lightcurve |
|---|---|---|---|---|---|---|---|
| A | 22516 | 19537 | 0 | 0 | 0.00% | 0.00% |  |
| B | 22516 | 19536 | 9 | 9 | 0.04% | 0.05% |  |
| C | 22516 | 19537 | 0 | 0 | 0.00% | 0.00% |  |
| D | 22516 | 19536 | 92 | 92 | 0.41% | 0.47% |  |
Top three noisy pixels from each quadrant. If the there are fewer than three noisy pixels in the level2.evt file, extra rows are filled as -1
| Pixel properties | Quadrant properties | ||||||
|---|---|---|---|---|---|---|---|
| Quadrant | DetID | PixID | Counts | Sigma | Mean | Median | Sigma |
| A | 15 | 174 | 209692 | 905.85 | 1056 | 1032 | 230.3 |
| A | 4 | 2 | 100262 | 430.78 | 1056 | 1032 | 230.3 |
| A | 0 | 226 | 7032 | 26.05 | 1056 | 1032 | 230.3 |
| B | 0 | 197 | 99532 | 480.27 | 1071 | 1044 | 205.1 |
| B | 3 | 64 | 91476 | 440.99 | 1071 | 1044 | 205.1 |
| B | 0 | 189 | 43755 | 208.28 | 1071 | 1044 | 205.1 |
| C | 3 | 233 | 66162 | 268.89 | 1032 | 1025 | 242.2 |
| C | 5 | 218 | 17866 | 69.52 | 1032 | 1025 | 242.2 |
| C | 9 | 160 | 13367 | 50.95 | 1032 | 1025 | 242.2 |
| D | 7 | 238 | 3232427 | 13271.78 | 1053 | 1016 | 243.5 |
| D | 10 | 70 | 311787 | 1276.37 | 1053 | 1016 | 243.5 |
| D | 11 | 176 | 300602 | 1230.43 | 1053 | 1016 | 243.5 |
Histogram calculated using DETX and DETY for each event in the final _common_clean file
| Quadrant A |  |
 |
Quadrant B |
|---|---|---|---|
| Quadrant D |  |
 |
Quadrant C |
| Plot type | Count rate plots | Images |
|---|---|---|
| Comparison with Poisson distribution Blue bars denote a histogram of data divided into 1 sec bins. Red curve is a Poisson curve with rate = median count rate of data. |
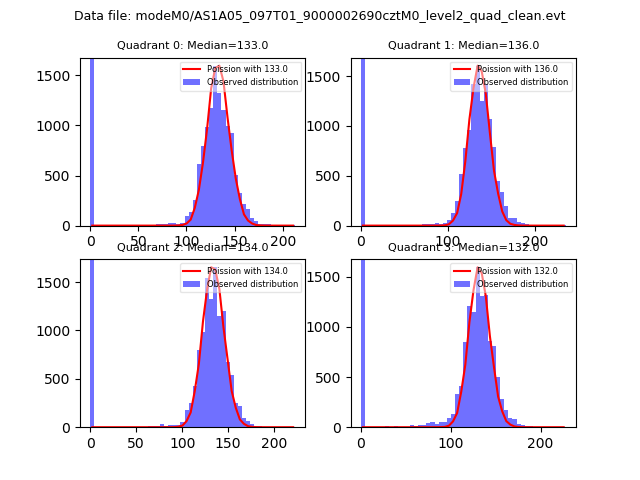 |
 |
| Quadrant-wise count rates Data is divided into 100 sec bins |
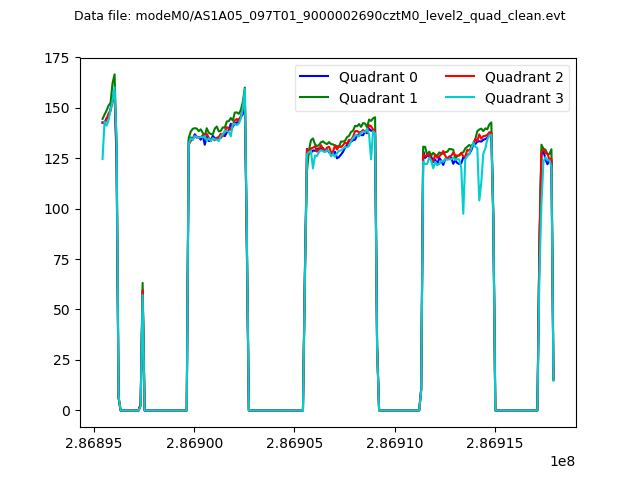 |
|
| Module-wise count rates for Quadrant A Data is divided into 100 sec bins |
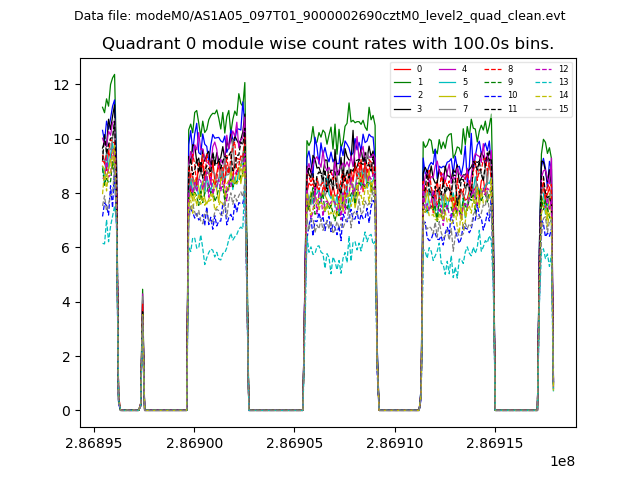 |
 |
| Module-wise count rates for Quadrant B Data is divided into 100 sec bins |
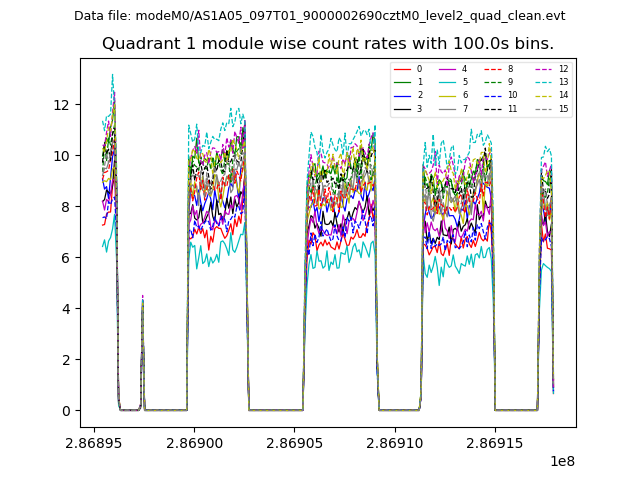 |
 |
| Module-wise count rates for Quadrant C Data is divided into 100 sec bins |
 |
 |
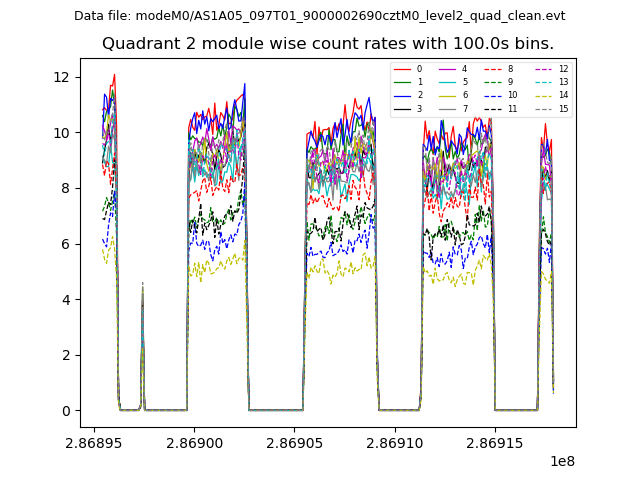
| Module-wise count rates for Quadrant D Data is divided into 100 sec bins |
 |
 |
| Parameter | Plot |
|---|---|
| CZT HV Monitor |  |
| D_VDD |  |
| Temperature 1 |  |
| Veto HV Monitor |  |
| Veto LLD |  |
| Alpha Counter |  |
| _CPM_Rate |  |
| CZT Counter |  |
| +2.5 Volts monitor | 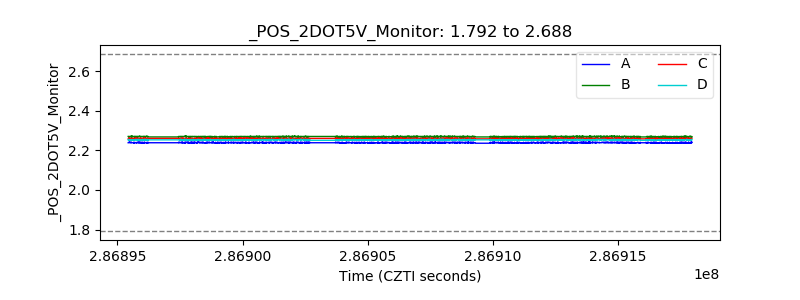 |
| +5 Volts monitor |  |
| _ROLL_ROT | 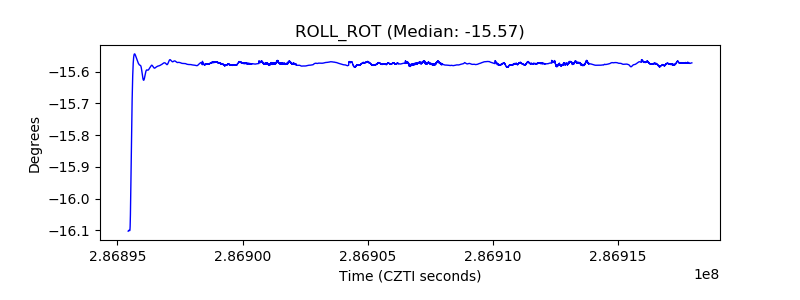 |
| _Roll_DEC |  |
| _Roll_RA |  |
| Veto Counter | 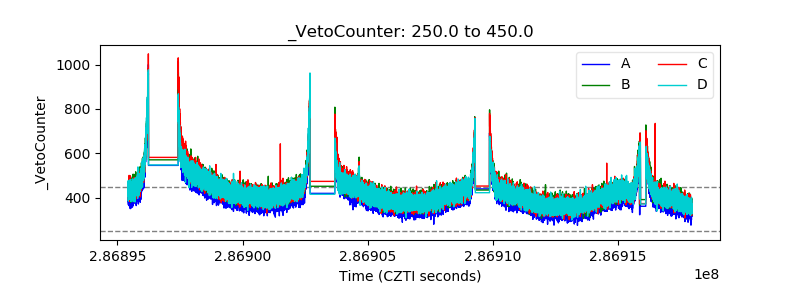 |