| Param | Original file | Final file |
|---|---|---|
| Filename | modeM0/AS1T03_080T01_9000002686cztM0_level2_bc.evt | modeM0/AS1T03_080T01_9000002686cztM0_level2_quad_clean.evt |
| Size (bytes) | 2,209,052,160 | 1,195,153,920 |
| Size | 2.1 GB | 1.1 GB |
| Events in quadrant A | 13,402,186 | 8,205,174 |
| Events in quadrant B | 13,658,295 | 8,162,311 |
| Events in quadrant C | 12,452,387 | 7,948,470 |
| Events in quadrant D | 23,244,226 | 7,719,041 |
| Mode M9 | |||
|---|---|---|---|
| Quadrant | BADHDUFLAG | Total packets | Discarded packets |
| A | 0 | 106 | 0 |
| B | 0 | 106 | 0 |
| C | 0 | 106 | 0 |
| D | 0 | 106 | 0 |
| Mode SS | |||
|---|---|---|---|
| Quadrant | BADHDUFLAG | Total packets | Discarded packets |
| A | 0 | 1236 | 0 |
| B | 0 | 1236 | 0 |
| C | 0 | 1236 | 0 |
| D | 0 | 1236 | 0 |
| Mode M0 | |||
|---|---|---|---|
| Quadrant | BADHDUFLAG | Total packets | Discarded packets |
| A | 0 | 127716 | 0 |
| B | 0 | 128305 | 0 |
| C | 0 | 125297 | 0 |
| D | 0 | 161920 | 0 |
| Quadrant | Total seconds | Saturated seconds | Saturation percentage |
|---|---|---|---|
| A | 60790 | 808 | 1.329166% |
| B | 60790 | 855 | 1.406481% |
| C | 60790 | 886 | 1.457477% |
| D | 60790 | 3971 | 6.532324% |
Noise dominated data is calculated using 1-second bins in cleaned event files. If a bin has >2000 counts, and if more than 50% of those come from <1% of pixels, then it is considered to be noise-dominated and hence unusable.
| Quadrant | # 1 sec bins | Bins with >0 counts | Bins with >2000 counts | High rate bins dominated by noise | Noise dominated (total time) | Noise dominated (detector-on time) | Marked lightcurve |
|---|---|---|---|---|---|---|---|
| A | 71260 | 60791 | 14 | 14 | 0.02% | 0.02% |  |
| B | 71260 | 60789 | 22 | 22 | 0.03% | 0.04% |  |
| C | 71260 | 60789 | 0 | 0 | 0.00% | 0.00% |  |
| D | 71260 | 60788 | 1154 | 1154 | 1.62% | 1.90% |  |
Top three noisy pixels from each quadrant. If the there are fewer than three noisy pixels in the level2.evt file, extra rows are filled as -1
| Pixel properties | Quadrant properties | ||||||
|---|---|---|---|---|---|---|---|
| Quadrant | DetID | PixID | Counts | Sigma | Mean | Median | Sigma |
| A | 4 | 2 | 343828 | 472.02 | 3279 | 3231 | 721.6 |
| A | 15 | 174 | 258456 | 353.71 | 3279 | 3231 | 721.6 |
| A | 14 | 4 | 150073 | 203.5 | 3279 | 3231 | 721.6 |
| B | 0 | 189 | 261272 | 417.61 | 3243 | 3163 | 618.1 |
| B | 3 | 64 | 211553 | 337.17 | 3243 | 3163 | 618.1 |
| B | 7 | 220 | 135083 | 213.44 | 3243 | 3163 | 618.1 |
| C | 3 | 233 | 299976 | 387.39 | 3138 | 3112 | 766.3 |
| C | 0 | 207 | 31953 | 37.64 | 3138 | 3112 | 766.3 |
| C | 9 | 160 | 22562 | 25.38 | 3138 | 3112 | 766.3 |
| D | 11 | 176 | 5782541 | 7502.87 | 3178 | 3069 | 770.3 |
| D | 7 | 238 | 3764403 | 4882.93 | 3178 | 3069 | 770.3 |
| D | 1 | 52 | 641955 | 829.4 | 3178 | 3069 | 770.3 |
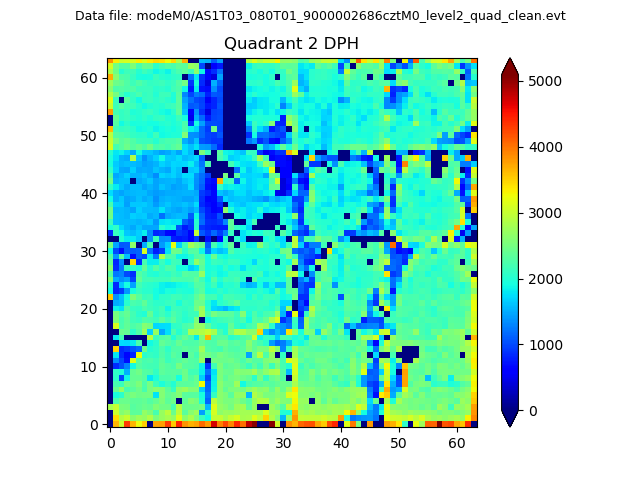
Histogram calculated using DETX and DETY for each event in the final _common_clean file
| Quadrant A |  |
 |
Quadrant B |
|---|---|---|---|
| Quadrant D |  |
 |
Quadrant C |
| Plot type | Count rate plots | Images |
|---|---|---|
| Comparison with Poisson distribution Blue bars denote a histogram of data divided into 1 sec bins. Red curve is a Poisson curve with rate = median count rate of data. |
 |
 |
| Quadrant-wise count rates Data is divided into 100 sec bins |
 |
|
| Module-wise count rates for Quadrant A Data is divided into 100 sec bins |
 |
 |
| Module-wise count rates for Quadrant B Data is divided into 100 sec bins |
 |
 |
| Module-wise count rates for Quadrant C Data is divided into 100 sec bins |
 |
 |
| Module-wise count rates for Quadrant D Data is divided into 100 sec bins |
 |
 |
| Parameter | Plot |
|---|---|
| CZT HV Monitor | 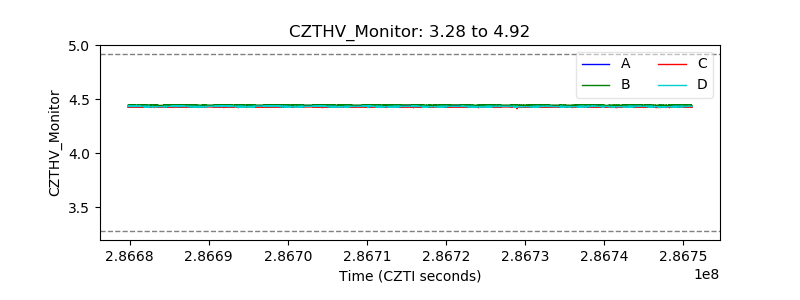 |
| D_VDD | 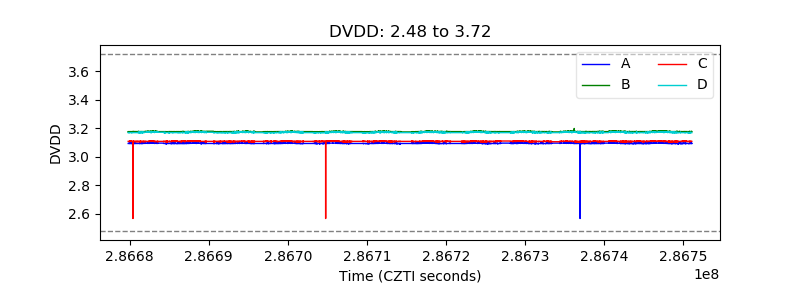 |
| Temperature 1 |  |
| Veto HV Monitor |  |
| Veto LLD |  |
| Alpha Counter |  |
| _CPM_Rate |  |
| CZT Counter |  |
| +2.5 Volts monitor | 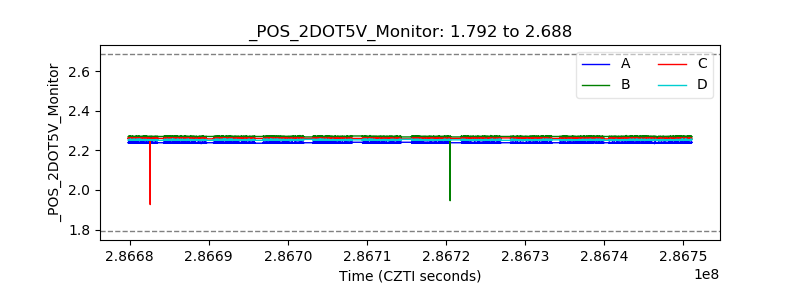 |
| +5 Volts monitor |  |
| _ROLL_ROT |  |
| _Roll_DEC |  |
| _Roll_RA |  |
| Veto Counter |  |