| Param | Original file | Final file |
|---|---|---|
| Filename | modeM0/AS1A06_006T01_9000002684cztM0_level2_bc.evt | modeM0/AS1A06_006T01_9000002684cztM0_level2_quad_clean.evt |
| Size (bytes) | 3,179,321,280 | 1,015,200,000 |
| Size | 3.0 GB | 968.2 MB |
| Events in quadrant A | 20,669,030 | 6,543,938 |
| Events in quadrant B | 17,013,267 | 6,649,172 |
| Events in quadrant C | 15,207,502 | 6,408,998 |
| Events in quadrant D | 38,386,039 | 6,102,261 |
| Mode SS | |||
|---|---|---|---|
| Quadrant | BADHDUFLAG | Total packets | Discarded packets |
| A | 0 | 1502 | 0 |
| B | 0 | 1502 | 0 |
| C | 0 | 1502 | 0 |
| D | 0 | 1502 | 0 |
| Mode M9 | |||
|---|---|---|---|
| Quadrant | BADHDUFLAG | Total packets | Discarded packets |
| A | 0 | 121 | 0 |
| B | 0 | 121 | 0 |
| C | 0 | 121 | 0 |
| D | 0 | 121 | 0 |
| Mode M0 | |||
|---|---|---|---|
| Quadrant | BADHDUFLAG | Total packets | Discarded packets |
| A | 0 | 187513 | 0 |
| B | 0 | 158602 | 0 |
| C | 0 | 154110 | 0 |
| D | 0 | 231800 | 0 |
| Quadrant | Total seconds | Saturated seconds | Saturation percentage |
|---|---|---|---|
| A | 73561 | 5505 | 7.483585% |
| B | 73561 | 1102 | 1.498076% |
| C | 73561 | 1119 | 1.521186% |
| D | 73561 | 5884 | 7.998804% |
Noise dominated data is calculated using 1-second bins in cleaned event files. If a bin has >2000 counts, and if more than 50% of those come from <1% of pixels, then it is considered to be noise-dominated and hence unusable.
| Quadrant | # 1 sec bins | Bins with >0 counts | Bins with >2000 counts | High rate bins dominated by noise | Noise dominated (total time) | Noise dominated (detector-on time) | Marked lightcurve |
|---|---|---|---|---|---|---|---|
| A | 85636 | 73561 | 87 | 87 | 0.10% | 0.12% |  |
| B | 85636 | 73558 | 34 | 34 | 0.04% | 0.05% |  |
| C | 85636 | 73559 | 0 | 0 | 0.00% | 0.00% |  |
| D | 85635 | 73557 | 1732 | 1732 | 2.02% | 2.35% | 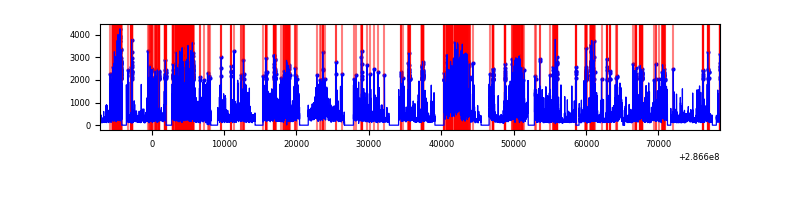 |
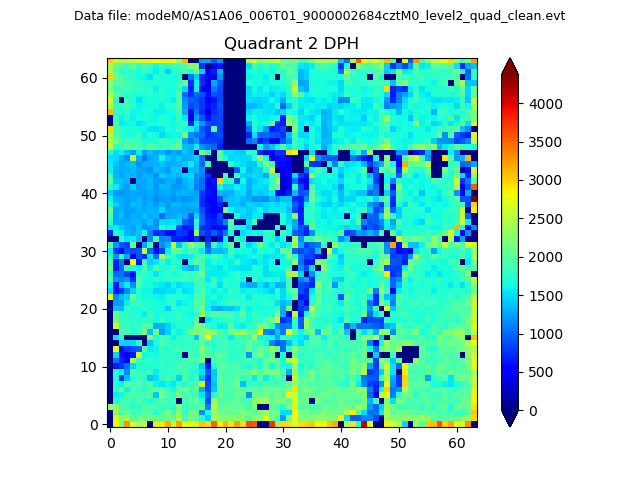
Top three noisy pixels from each quadrant. If the there are fewer than three noisy pixels in the level2.evt file, extra rows are filled as -1
| Pixel properties | Quadrant properties | ||||||
|---|---|---|---|---|---|---|---|
| Quadrant | DetID | PixID | Counts | Sigma | Mean | Median | Sigma |
| A | 14 | 111 | 2989063 | 3539.64 | 3893 | 3828 | 843.4 |
| A | 15 | 174 | 1590107 | 1880.88 | 3893 | 3828 | 843.4 |
| A | 4 | 2 | 1099248 | 1298.86 | 3893 | 3828 | 843.4 |
| B | 3 | 64 | 641458 | 859.16 | 3964 | 3867 | 742.1 |
| B | 7 | 220 | 279820 | 371.85 | 3964 | 3867 | 742.1 |
| B | 0 | 189 | 260305 | 345.55 | 3964 | 3867 | 742.1 |
| C | 3 | 233 | 502251 | 564.02 | 3775 | 3761 | 883.8 |
| C | 9 | 160 | 59694 | 63.29 | 3775 | 3761 | 883.8 |
| C | 0 | 207 | 54260 | 57.14 | 3775 | 3761 | 883.8 |
| D | 5 | 222 | 10133208 | 11406.22 | 3788 | 3657 | 888.1 |
| D | 11 | 176 | 7475414 | 8413.45 | 3788 | 3657 | 888.1 |
| D | 7 | 238 | 4197654 | 4722.58 | 3788 | 3657 | 888.1 |
Histogram calculated using DETX and DETY for each event in the final _common_clean file
| Quadrant A |  |
 |
Quadrant B |
|---|---|---|---|
| Quadrant D |  |
 |
Quadrant C |
| Plot type | Count rate plots | Images |
|---|---|---|
| Comparison with Poisson distribution Blue bars denote a histogram of data divided into 1 sec bins. Red curve is a Poisson curve with rate = median count rate of data. |
 |
 |
| Quadrant-wise count rates Data is divided into 100 sec bins |
 |
|
| Module-wise count rates for Quadrant A Data is divided into 100 sec bins |
 |
 |
| Module-wise count rates for Quadrant B Data is divided into 100 sec bins |
 |
 |
| Module-wise count rates for Quadrant C Data is divided into 100 sec bins |
 |
 |
| Module-wise count rates for Quadrant D Data is divided into 100 sec bins |
 |
 |
| Parameter | Plot |
|---|---|
| CZT HV Monitor |  |
| D_VDD |  |
| Temperature 1 |  |
| Veto HV Monitor |  |
| Veto LLD |  |
| Alpha Counter |  |
| _CPM_Rate |  |
| CZT Counter |  |
| +2.5 Volts monitor |  |
| +5 Volts monitor |  |
| _ROLL_ROT | 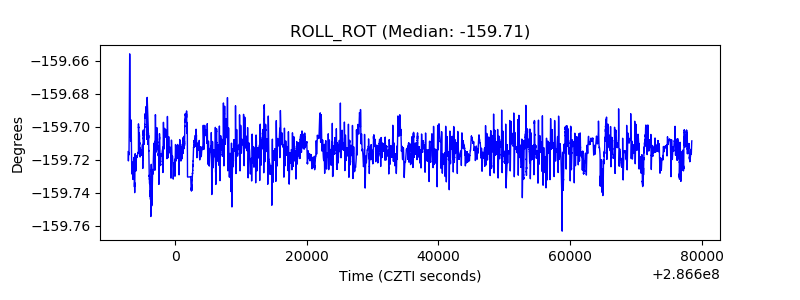 |
| _Roll_DEC |  |
| _Roll_RA |  |
| Veto Counter |  |