| Param | Original file | Final file |
|---|---|---|
| Filename | modeM0/AS1A06_003T04_9000002682cztM0_level2_bc.evt | modeM0/AS1A06_003T04_9000002682cztM0_level2_quad_clean.evt |
| Size (bytes) | 4,677,799,680 | 1,686,058,560 |
| Size | 4.4 GB | 1.6 GB |
| Events in quadrant A | 29,473,648 | 10,796,527 |
| Events in quadrant B | 28,558,014 | 11,096,308 |
| Events in quadrant C | 26,397,020 | 10,449,172 |
| Events in quadrant D | 48,673,242 | 10,112,168 |
| Mode SS | |||
|---|---|---|---|
| Quadrant | BADHDUFLAG | Total packets | Discarded packets |
| A | 0 | 2562 | 0 |
| B | 0 | 2562 | 0 |
| C | 0 | 2562 | 0 |
| D | 0 | 2562 | 0 |
| Mode M0 | |||
|---|---|---|---|
| Quadrant | BADHDUFLAG | Total packets | Discarded packets |
| A | 0 | 288945 | 0 |
| B | 0 | 268635 | 0 |
| C | 0 | 263790 | 0 |
| D | 0 | 333962 | 0 |
| Mode M9 | |||
|---|---|---|---|
| Quadrant | BADHDUFLAG | Total packets | Discarded packets |
| A | 0 | 212 | 0 |
| B | 0 | 212 | 0 |
| C | 0 | 212 | 0 |
| D | 0 | 212 | 0 |
| Quadrant | Total seconds | Saturated seconds | Saturation percentage |
|---|---|---|---|
| A | 125690 | 8940 | 7.112738% |
| B | 125690 | 1730 | 1.376402% |
| C | 125690 | 1961 | 1.560188% |
| D | 125690 | 7146 | 5.685417% |
Noise dominated data is calculated using 1-second bins in cleaned event files. If a bin has >2000 counts, and if more than 50% of those come from <1% of pixels, then it is considered to be noise-dominated and hence unusable.
| Quadrant | # 1 sec bins | Bins with >0 counts | Bins with >2000 counts | High rate bins dominated by noise | Noise dominated (total time) | Noise dominated (detector-on time) | Marked lightcurve |
|---|---|---|---|---|---|---|---|
| A | 146040 | 125688 | 34 | 34 | 0.02% | 0.03% | 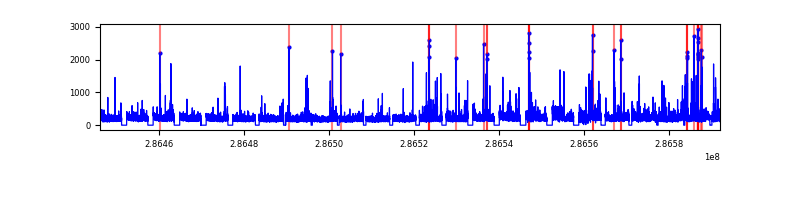 |
| B | 146039 | 125689 | 60 | 60 | 0.04% | 0.05% |  |
| C | 146039 | 125693 | 46 | 46 | 0.03% | 0.04% |  |
| D | 146039 | 125688 | 2646 | 2646 | 1.81% | 2.11% |  |
Top three noisy pixels from each quadrant. If the there are fewer than three noisy pixels in the level2.evt file, extra rows are filled as -1
| Pixel properties | Quadrant properties | ||||||
|---|---|---|---|---|---|---|---|
| Quadrant | DetID | PixID | Counts | Sigma | Mean | Median | Sigma |
| A | 14 | 111 | 2225876 | 1542.68 | 6648 | 6525 | 1438.6 |
| A | 15 | 174 | 1451262 | 1004.24 | 6648 | 6525 | 1438.6 |
| A | 4 | 2 | 269662 | 182.91 | 6648 | 6525 | 1438.6 |
| B | 3 | 64 | 1169849 | 899.39 | 6793 | 6612 | 1293.4 |
| B | 0 | 197 | 299968 | 226.82 | 6793 | 6612 | 1293.4 |
| B | 7 | 220 | 202093 | 151.14 | 6793 | 6612 | 1293.4 |
| C | 3 | 233 | 435775 | 287.73 | 6416 | 6390 | 1492.3 |
| C | 9 | 160 | 389609 | 256.8 | 6416 | 6390 | 1492.3 |
| C | 0 | 207 | 351247 | 231.09 | 6416 | 6390 | 1492.3 |
| D | 7 | 238 | 9519865 | 6344.1 | 6537 | 6324 | 1499.6 |
| D | 5 | 222 | 4796367 | 3194.24 | 6537 | 6324 | 1499.6 |
| D | 11 | 176 | 4650462 | 3096.94 | 6537 | 6324 | 1499.6 |
Histogram calculated using DETX and DETY for each event in the final _common_clean file
| Quadrant A |  |
 |
Quadrant B |
|---|---|---|---|
| Quadrant D |  |
 |
Quadrant C |
| Plot type | Count rate plots | Images |
|---|---|---|
| Comparison with Poisson distribution Blue bars denote a histogram of data divided into 1 sec bins. Red curve is a Poisson curve with rate = median count rate of data. |
 |
 |
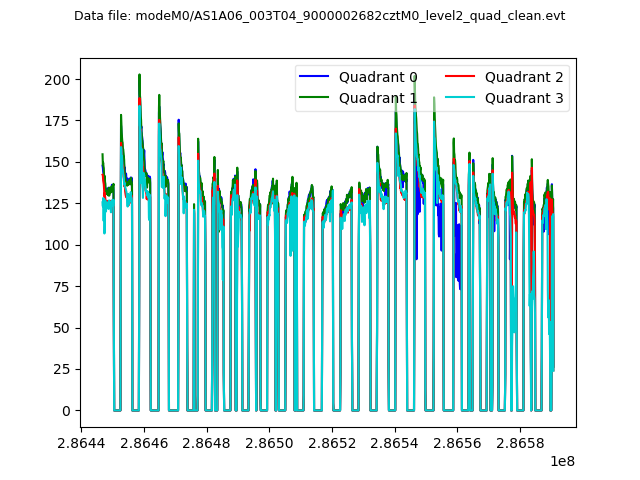
| Quadrant-wise count rates Data is divided into 100 sec bins |
 |
|
| Module-wise count rates for Quadrant A Data is divided into 100 sec bins |
 |
 |
| Module-wise count rates for Quadrant B Data is divided into 100 sec bins |
 |
 |
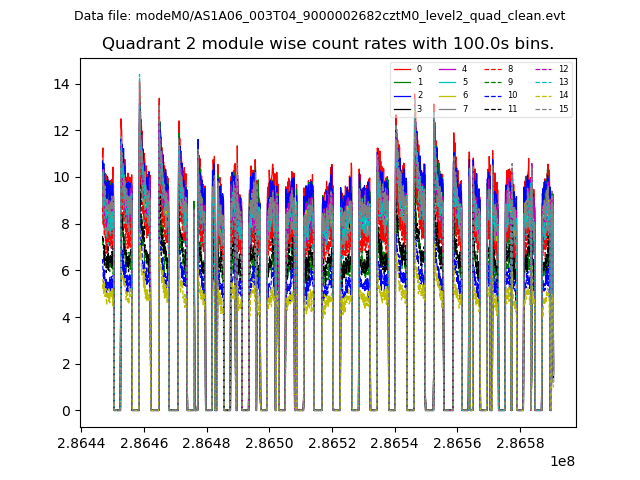
| Module-wise count rates for Quadrant C Data is divided into 100 sec bins |
 |
 |
| Module-wise count rates for Quadrant D Data is divided into 100 sec bins |
 |
 |
| Parameter | Plot |
|---|---|
| CZT HV Monitor |  |
| D_VDD |  |
| Temperature 1 | 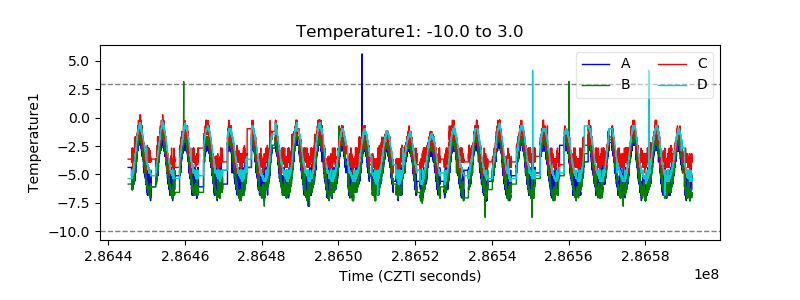 |
| Veto HV Monitor |  |
| Veto LLD | 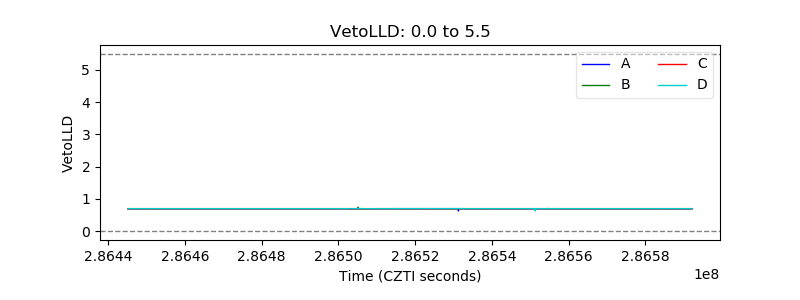 |
| Alpha Counter |  |
| _CPM_Rate |  |
| CZT Counter |  |
| +2.5 Volts monitor | 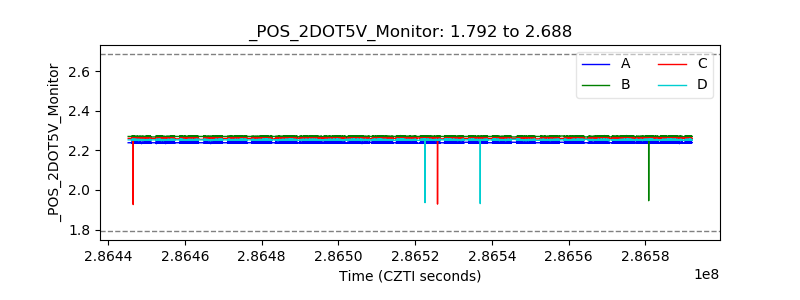 |
| +5 Volts monitor | 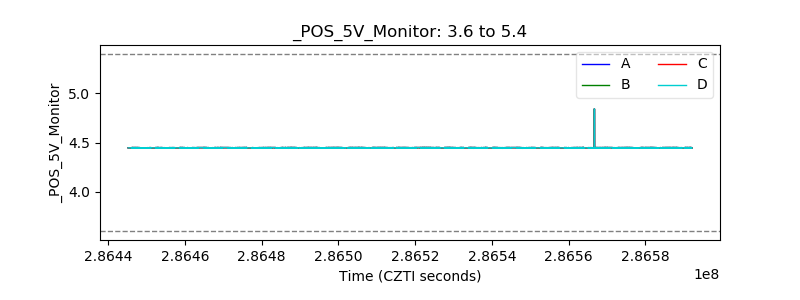 |
| _ROLL_ROT |  |
| _Roll_DEC |  |
| _Roll_RA |  |
| Veto Counter | 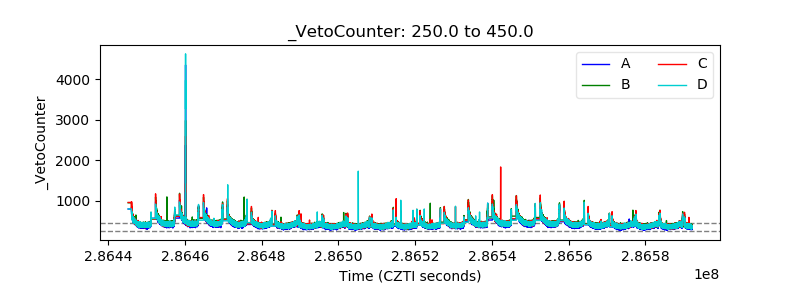 |