| Param | Original file | Final file |
|---|---|---|
| Filename | modeM0/AS1A05_159T01_9000002678cztM0_level2_bc.evt | modeM0/AS1A05_159T01_9000002678cztM0_level2_quad_clean.evt |
| Size (bytes) | 7,844,808,960 | 3,025,716,480 |
| Size | 7.3 GB | 2.8 GB |
| Events in quadrant A | 50,262,246 | 19,985,962 |
| Events in quadrant B | 49,018,904 | 20,079,041 |
| Events in quadrant C | 51,087,146 | 19,048,151 |
| Events in quadrant D | 73,282,921 | 18,516,048 |
| Mode SS | |||
|---|---|---|---|
| Quadrant | BADHDUFLAG | Total packets | Discarded packets |
| A | 0 | 4176 | 0 |
| B | 0 | 4176 | 0 |
| C | 0 | 4176 | 0 |
| D | 0 | 4176 | 0 |
| Mode M9 | |||
|---|---|---|---|
| Quadrant | BADHDUFLAG | Total packets | Discarded packets |
| A | 0 | 333 | 0 |
| B | 0 | 333 | 0 |
| C | 0 | 333 | 0 |
| D | 0 | 333 | 0 |
| Mode M0 | |||
|---|---|---|---|
| Quadrant | BADHDUFLAG | Total packets | Discarded packets |
| A | 0 | 449197 | 0 |
| B | 0 | 444676 | 0 |
| C | 0 | 454016 | 0 |
| D | 0 | 526435 | 0 |
| Quadrant | Total seconds | Saturated seconds | Saturation percentage |
|---|---|---|---|
| A | 204729 | 3538 | 1.728138% |
| B | 204728 | 3350 | 1.636317% |
| C | 204729 | 3902 | 1.905934% |
| D | 204729 | 6751 | 3.297530% |
Noise dominated data is calculated using 1-second bins in cleaned event files. If a bin has >2000 counts, and if more than 50% of those come from <1% of pixels, then it is considered to be noise-dominated and hence unusable.
| Quadrant | # 1 sec bins | Bins with >0 counts | Bins with >2000 counts | High rate bins dominated by noise | Noise dominated (total time) | Noise dominated (detector-on time) | Marked lightcurve |
|---|---|---|---|---|---|---|---|
| A | 238320 | 204720 | 230 | 230 | 0.10% | 0.11% |  |
| B | 238320 | 204725 | 104 | 104 | 0.04% | 0.05% |  |
| C | 238320 | 204730 | 184 | 184 | 0.08% | 0.09% | 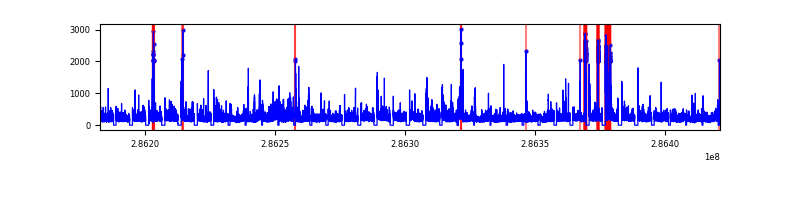 |
| D | 238320 | 204726 | 1094 | 1094 | 0.46% | 0.53% |  |
Top three noisy pixels from each quadrant. If the there are fewer than three noisy pixels in the level2.evt file, extra rows are filled as -1
| Pixel properties | Quadrant properties | ||||||
|---|---|---|---|---|---|---|---|
| Quadrant | DetID | PixID | Counts | Sigma | Mean | Median | Sigma |
| A | 15 | 174 | 3293393 | 1260.6 | 11673 | 11445 | 2603.5 |
| A | 6 | 16 | 1236264 | 470.46 | 11673 | 11445 | 2603.5 |
| A | 4 | 2 | 888648 | 336.94 | 11673 | 11445 | 2603.5 |
| B | 7 | 220 | 1160792 | 506.26 | 11745 | 11534 | 2270.1 |
| B | 5 | 172 | 530178 | 228.47 | 11745 | 11534 | 2270.1 |
| B | 0 | 197 | 448634 | 192.55 | 11745 | 11534 | 2270.1 |
| C | 3 | 233 | 3974327 | 1510.89 | 11089 | 11122 | 2623.1 |
| C | 0 | 207 | 3369562 | 1280.33 | 11089 | 11122 | 2623.1 |
| C | 8 | 208 | 573771 | 214.5 | 11089 | 11122 | 2623.1 |
| D | 5 | 222 | 12328431 | 4544.15 | 11303 | 10947 | 2710.6 |
| D | 11 | 176 | 7100775 | 2615.57 | 11303 | 10947 | 2710.6 |
| D | 7 | 238 | 5376504 | 1979.45 | 11303 | 10947 | 2710.6 |
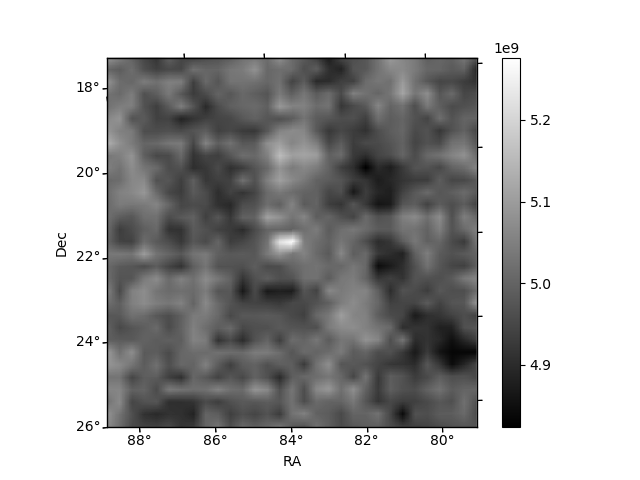
Histogram calculated using DETX and DETY for each event in the final _common_clean file
| Quadrant A |  |
 |
Quadrant B |
|---|---|---|---|
| Quadrant D |  |
 |
Quadrant C |
| Plot type | Count rate plots | Images |
|---|---|---|
| Comparison with Poisson distribution Blue bars denote a histogram of data divided into 1 sec bins. Red curve is a Poisson curve with rate = median count rate of data. |
 |
 |
| Quadrant-wise count rates Data is divided into 100 sec bins |
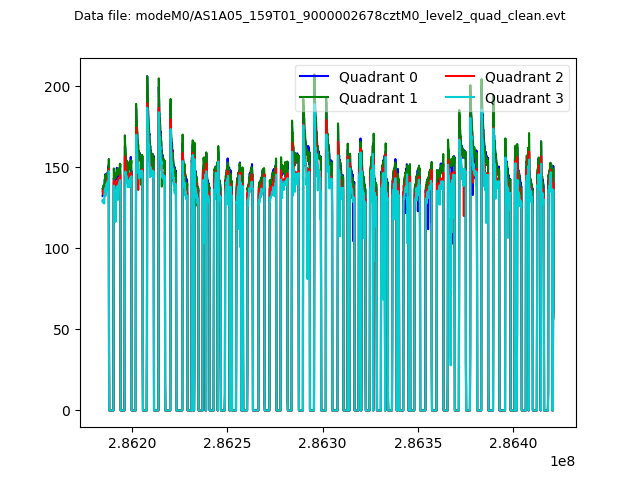 |
|
| Module-wise count rates for Quadrant A Data is divided into 100 sec bins |
 |
 |
| Module-wise count rates for Quadrant B Data is divided into 100 sec bins |
 |
 |
| Module-wise count rates for Quadrant C Data is divided into 100 sec bins |
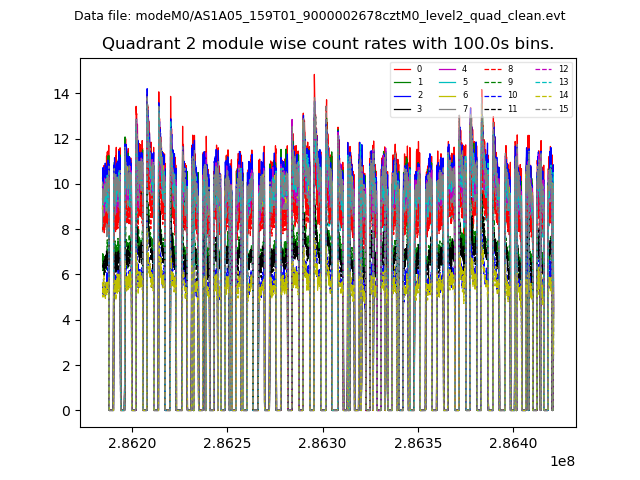 |
 |
| Module-wise count rates for Quadrant D Data is divided into 100 sec bins |
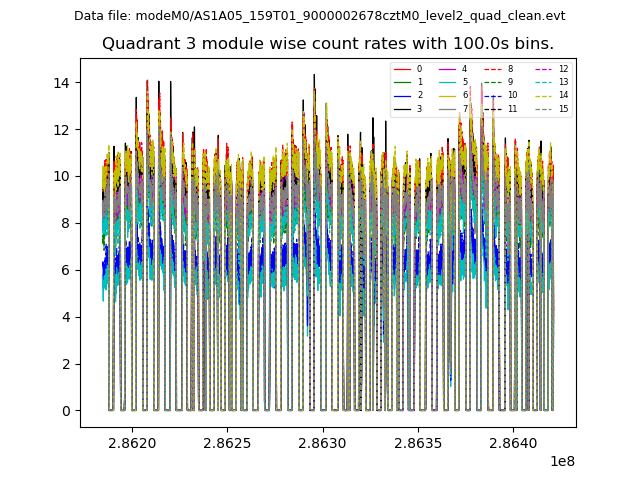 |
 |
| Parameter | Plot |
|---|---|
| CZT HV Monitor |  |
| D_VDD |  |
| Temperature 1 |  |
| Veto HV Monitor |  |
| Veto LLD |  |
| Alpha Counter | 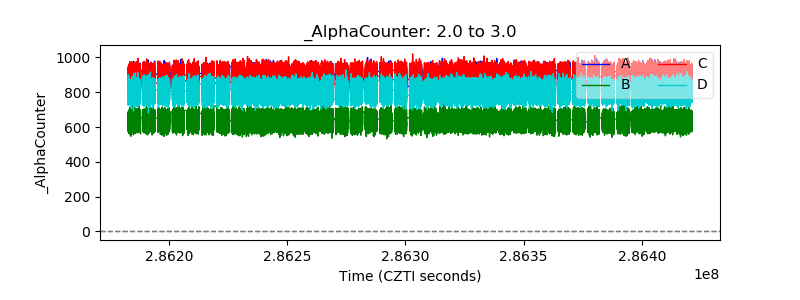 |
| _CPM_Rate | 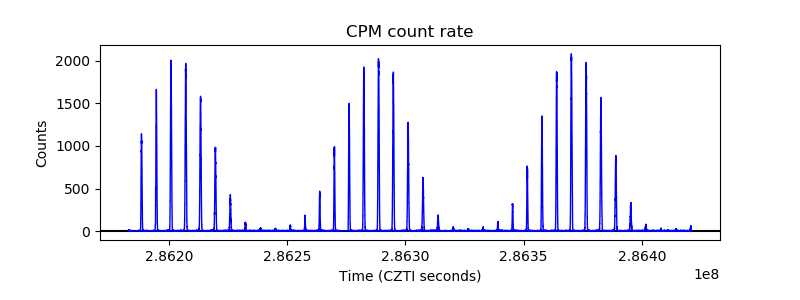 |
| CZT Counter |  |
| +2.5 Volts monitor |  |
| +5 Volts monitor | 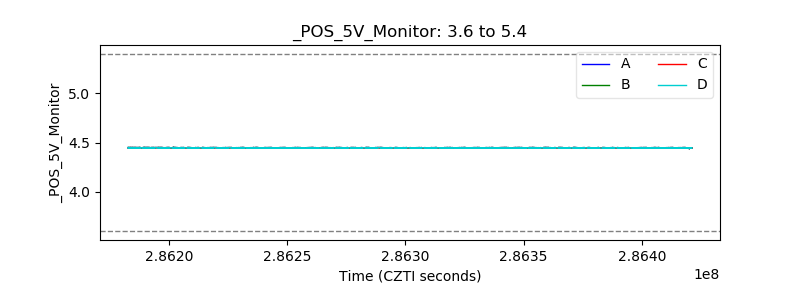 |
| _ROLL_ROT |  |
| _Roll_DEC |  |
| _Roll_RA | 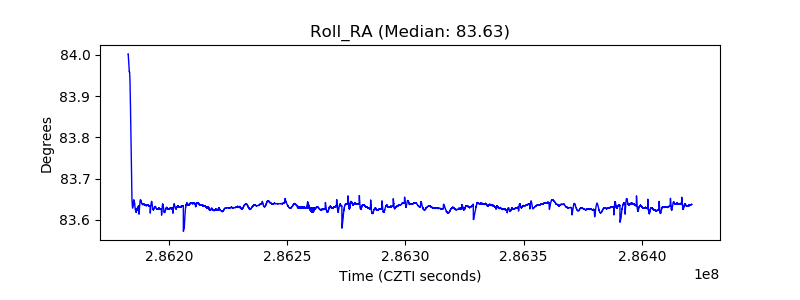 |
| Veto Counter | 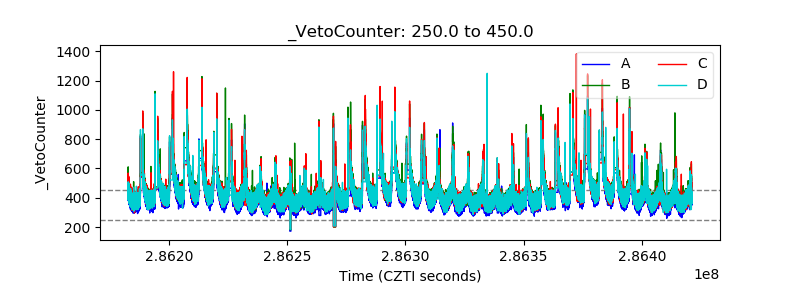 |