| Param | Original file | Final file |
|---|---|---|
| Filename | modeM0/AS1C04_009T03_9000002674cztM0_level2_bc.evt | modeM0/AS1C04_009T03_9000002674cztM0_level2_quad_clean.evt |
| Size (bytes) | 254,211,840 | 148,815,360 |
| Size | 242.4 MB | 141.9 MB |
| Events in quadrant A | 1,622,399 | 1,014,314 |
| Events in quadrant B | 1,747,501 | 1,030,506 |
| Events in quadrant C | 1,560,087 | 988,927 |
| Events in quadrant D | 2,263,451 | 965,449 |
| Mode SS | |||
|---|---|---|---|
| Quadrant | BADHDUFLAG | Total packets | Discarded packets |
| A | 0 | 148 | 0 |
| B | 0 | 148 | 0 |
| C | 0 | 148 | 0 |
| D | 0 | 148 | 0 |
| Mode M0 | |||
|---|---|---|---|
| Quadrant | BADHDUFLAG | Total packets | Discarded packets |
| A | 0 | 15224 | 0 |
| B | 0 | 15891 | 0 |
| C | 0 | 15212 | 0 |
| D | 0 | 17766 | 0 |
| Mode M9 | |||
|---|---|---|---|
| Quadrant | BADHDUFLAG | Total packets | Discarded packets |
| A | 0 | 20 | 0 |
| B | 0 | 20 | 0 |
| C | 0 | 20 | 0 |
| D | 0 | 20 | 0 |
| Quadrant | Total seconds | Saturated seconds | Saturation percentage |
|---|---|---|---|
| A | 7308 | 80 | 1.094691% |
| B | 7308 | 114 | 1.559934% |
| C | 7308 | 112 | 1.532567% |
| D | 7308 | 334 | 4.570334% |
Noise dominated data is calculated using 1-second bins in cleaned event files. If a bin has >2000 counts, and if more than 50% of those come from <1% of pixels, then it is considered to be noise-dominated and hence unusable.
| Quadrant | # 1 sec bins | Bins with >0 counts | Bins with >2000 counts | High rate bins dominated by noise | Noise dominated (total time) | Noise dominated (detector-on time) | Marked lightcurve |
|---|---|---|---|---|---|---|---|
| A | 8648 | 7308 | 1 | 1 | 0.01% | 0.01% |  |
| B | 8648 | 7308 | 2 | 2 | 0.02% | 0.03% |  |
| C | 8648 | 7308 | 2 | 2 | 0.02% | 0.03% |  |
| D | 8648 | 7308 | 59 | 59 | 0.68% | 0.81% |  |
Top three noisy pixels from each quadrant. If the there are fewer than three noisy pixels in the level2.evt file, extra rows are filled as -1
| Pixel properties | Quadrant properties | ||||||
|---|---|---|---|---|---|---|---|
| Quadrant | DetID | PixID | Counts | Sigma | Mean | Median | Sigma |
| A | 15 | 174 | 48017 | 527.71 | 406 | 399 | 90.2 |
| A | 14 | 237 | 18182 | 197.07 | 406 | 399 | 90.2 |
| A | 0 | 226 | 2669 | 25.16 | 406 | 399 | 90.2 |
| B | 7 | 220 | 75492 | 948.79 | 410 | 402 | 79.1 |
| B | 0 | 197 | 28594 | 356.22 | 410 | 402 | 79.1 |
| B | 0 | 219 | 14169 | 173.95 | 410 | 402 | 79.1 |
| C | 3 | 233 | 23201 | 241.21 | 393 | 391 | 94.6 |
| C | 9 | 160 | 9336 | 94.59 | 393 | 391 | 94.6 |
| C | 9 | 176 | 6599 | 65.65 | 393 | 391 | 94.6 |
| D | 7 | 238 | 494220 | 4741.41 | 394 | 384 | 104.2 |
| D | 10 | 70 | 71371 | 681.56 | 394 | 384 | 104.2 |
| D | 5 | 222 | 65456 | 624.77 | 394 | 384 | 104.2 |
Histogram calculated using DETX and DETY for each event in the final _common_clean file
| Quadrant A |  |
 |
Quadrant B |
|---|---|---|---|
| Quadrant D | 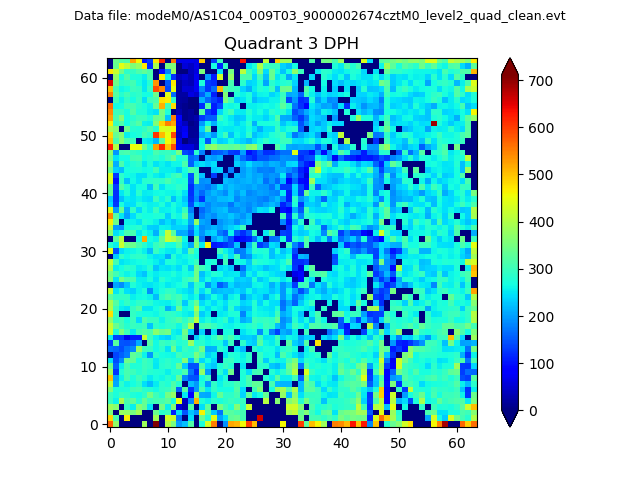 |
 |
Quadrant C |
| Plot type | Count rate plots | Images |
|---|---|---|
| Comparison with Poisson distribution Blue bars denote a histogram of data divided into 1 sec bins. Red curve is a Poisson curve with rate = median count rate of data. |
 |
 |
| Quadrant-wise count rates Data is divided into 100 sec bins |
 |
|
| Module-wise count rates for Quadrant A Data is divided into 100 sec bins |
 |
 |
| Module-wise count rates for Quadrant B Data is divided into 100 sec bins |
 |
 |
| Module-wise count rates for Quadrant C Data is divided into 100 sec bins |
 |
 |
| Module-wise count rates for Quadrant D Data is divided into 100 sec bins |
 |
 |
| Parameter | Plot |
|---|---|
| CZT HV Monitor |  |
| D_VDD |  |
| Temperature 1 |  |
| Veto HV Monitor |  |
| Veto LLD | 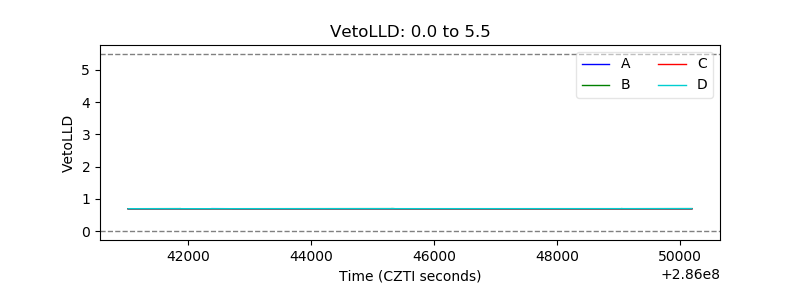 |
| Alpha Counter |  |
| _CPM_Rate |  |
| CZT Counter |  |
| +2.5 Volts monitor |  |
| +5 Volts monitor |  |
| _ROLL_ROT | 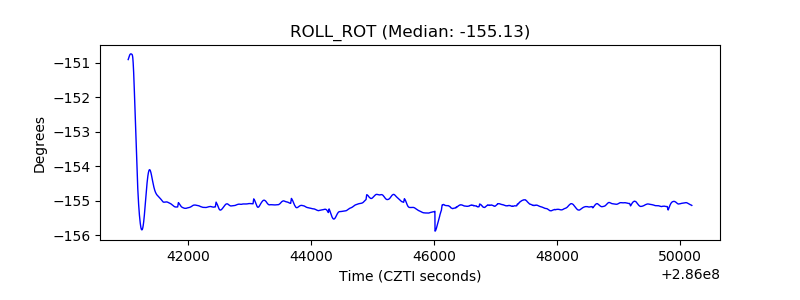 |
| _Roll_DEC |  |
| _Roll_RA |  |
| Veto Counter |  |