| Param | Original file | Final file |
|---|---|---|
| Filename | modeM0/AS1A05_108T02_9000002676cztM0_level2_bc.evt | modeM0/AS1A05_108T02_9000002676cztM0_level2_quad_clean.evt |
| Size (bytes) | 4,156,447,680 | 1,448,426,880 |
| Size | 3.9 GB | 1.3 GB |
| Events in quadrant A | 31,367,049 | 9,066,462 |
| Events in quadrant B | 24,324,690 | 9,318,715 |
| Events in quadrant C | 24,678,920 | 8,939,896 |
| Events in quadrant D | 37,740,395 | 8,730,914 |
| Mode SS | |||
|---|---|---|---|
| Quadrant | BADHDUFLAG | Total packets | Discarded packets |
| A | 0 | 2326 | 0 |
| B | 0 | 2326 | 0 |
| C | 0 | 2326 | 0 |
| D | 0 | 2326 | 0 |
| Mode M9 | |||
|---|---|---|---|
| Quadrant | BADHDUFLAG | Total packets | Discarded packets |
| A | 0 | 156 | 0 |
| B | 0 | 156 | 0 |
| C | 0 | 156 | 0 |
| D | 0 | 156 | 0 |
| Mode M0 | |||
|---|---|---|---|
| Quadrant | BADHDUFLAG | Total packets | Discarded packets |
| A | 0 | 265486 | 0 |
| B | 0 | 240229 | 0 |
| C | 0 | 241163 | 0 |
| D | 0 | 283810 | 0 |
| Quadrant | Total seconds | Saturated seconds | Saturation percentage |
|---|---|---|---|
| A | 114040 | 2799 | 2.454402% |
| B | 114040 | 1368 | 1.199579% |
| C | 114040 | 1689 | 1.481059% |
| D | 114040 | 3731 | 3.271659% |
Noise dominated data is calculated using 1-second bins in cleaned event files. If a bin has >2000 counts, and if more than 50% of those come from <1% of pixels, then it is considered to be noise-dominated and hence unusable.
| Quadrant | # 1 sec bins | Bins with >0 counts | Bins with >2000 counts | High rate bins dominated by noise | Noise dominated (total time) | Noise dominated (detector-on time) | Marked lightcurve |
|---|---|---|---|---|---|---|---|
| A | 129855 | 114042 | 270 | 270 | 0.21% | 0.24% | 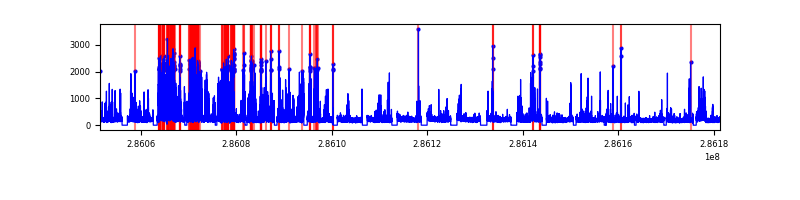 |
| B | 129855 | 114041 | 25 | 25 | 0.02% | 0.02% | 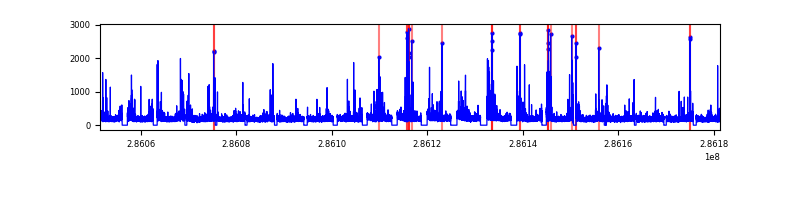 |
| C | 129855 | 114039 | 32 | 32 | 0.02% | 0.03% |  |
| D | 129855 | 114039 | 814 | 814 | 0.63% | 0.71% |  |
Top three noisy pixels from each quadrant. If the there are fewer than three noisy pixels in the level2.evt file, extra rows are filled as -1
| Pixel properties | Quadrant properties | ||||||
|---|---|---|---|---|---|---|---|
| Quadrant | DetID | PixID | Counts | Sigma | Mean | Median | Sigma |
| A | 14 | 237 | 7192306 | 5581.11 | 5906 | 5794 | 1287.6 |
| A | 15 | 174 | 1283335 | 992.15 | 5906 | 5794 | 1287.6 |
| A | 4 | 2 | 211903 | 160.07 | 5906 | 5794 | 1287.6 |
| B | 5 | 172 | 218824 | 189.19 | 5985 | 5831 | 1125.8 |
| B | 7 | 220 | 203310 | 175.41 | 5985 | 5831 | 1125.8 |
| B | 0 | 197 | 144653 | 123.31 | 5985 | 5831 | 1125.8 |
| C | 3 | 233 | 1450146 | 1075.25 | 5741 | 5705 | 1343.4 |
| C | 0 | 207 | 940438 | 695.82 | 5741 | 5705 | 1343.4 |
| C | 9 | 160 | 83160 | 57.66 | 5741 | 5705 | 1343.4 |
| D | 5 | 222 | 7626699 | 5263.83 | 5760 | 5601 | 1447.8 |
| D | 11 | 176 | 3371539 | 2324.83 | 5760 | 5601 | 1447.8 |
| D | 7 | 238 | 2981316 | 2055.3 | 5760 | 5601 | 1447.8 |
Histogram calculated using DETX and DETY for each event in the final _common_clean file
| Quadrant A | 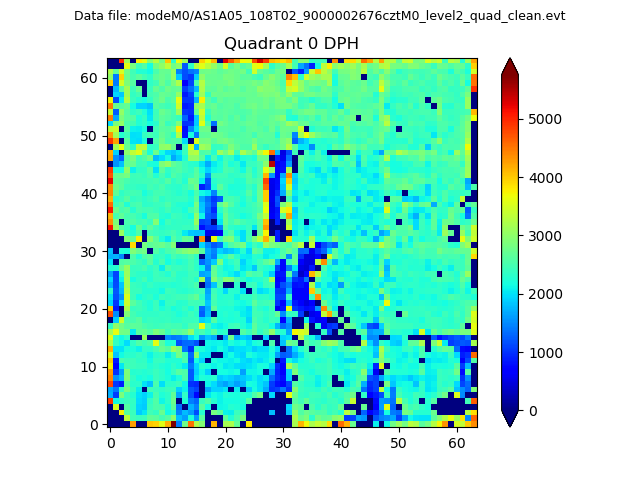 |
 |
Quadrant B |
|---|---|---|---|
| Quadrant D | 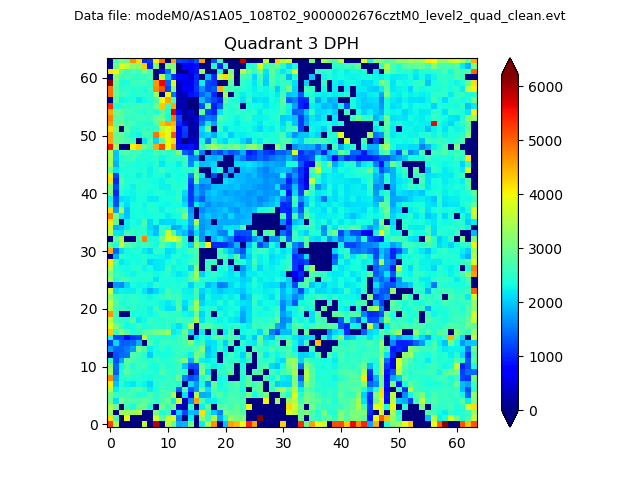 |
 |
Quadrant C |
| Plot type | Count rate plots | Images |
|---|---|---|
| Comparison with Poisson distribution Blue bars denote a histogram of data divided into 1 sec bins. Red curve is a Poisson curve with rate = median count rate of data. |
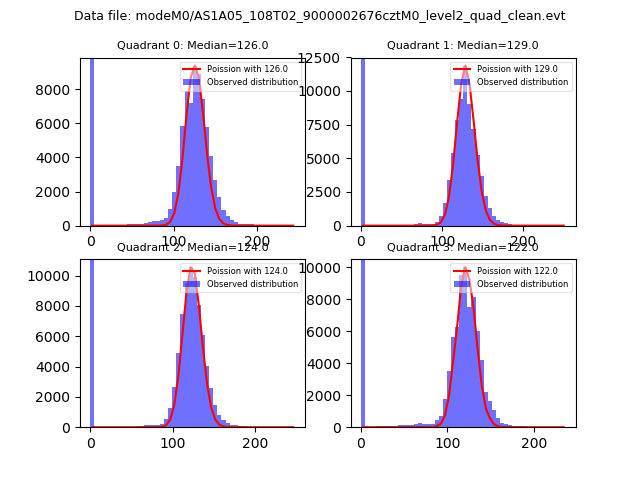 |
 |
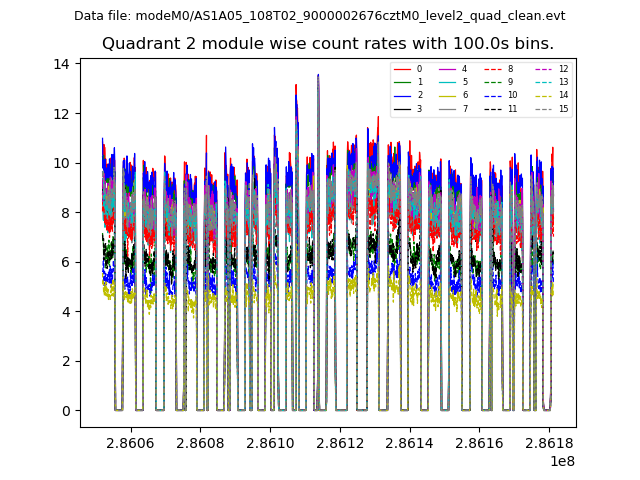
| Quadrant-wise count rates Data is divided into 100 sec bins |
 |
|
| Module-wise count rates for Quadrant A Data is divided into 100 sec bins |
 |
 |
| Module-wise count rates for Quadrant B Data is divided into 100 sec bins |
 |
 |
| Module-wise count rates for Quadrant C Data is divided into 100 sec bins |
 |
 |
| Module-wise count rates for Quadrant D Data is divided into 100 sec bins |
 |
 |
| Parameter | Plot |
|---|---|
| CZT HV Monitor |  |
| D_VDD |  |
| Temperature 1 | 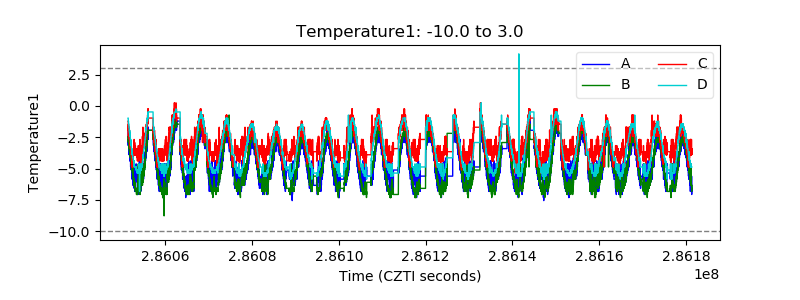 |
| Veto HV Monitor |  |
| Veto LLD | 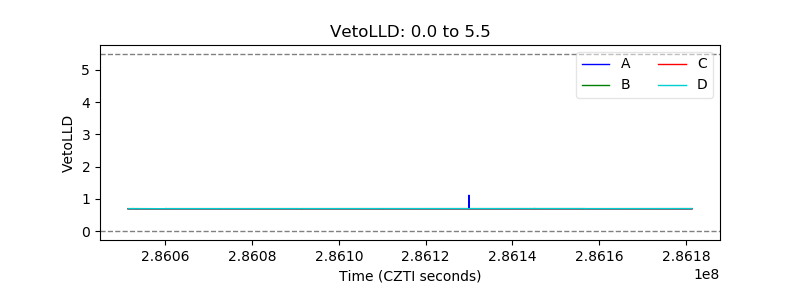 |
| Alpha Counter |  |
| _CPM_Rate | 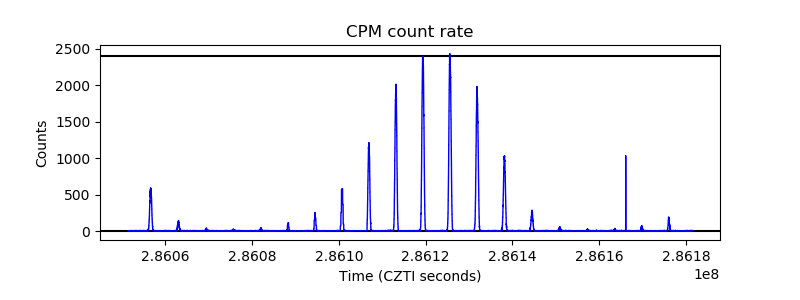 |
| CZT Counter |  |
| +2.5 Volts monitor |  |
| +5 Volts monitor |  |
| _ROLL_ROT |  |
| _Roll_DEC |  |
| _Roll_RA | 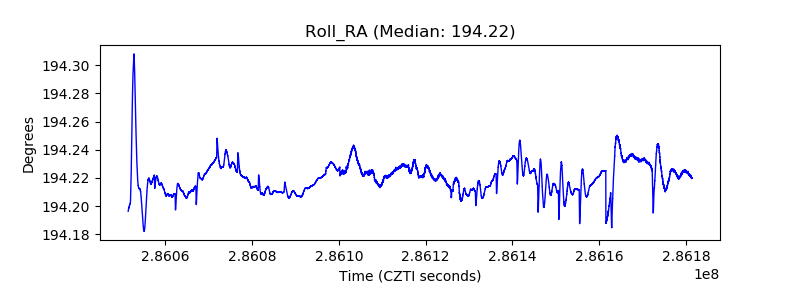 |
| Veto Counter |  |