| Param | Original file | Final file |
|---|---|---|
| Filename | modeM0/AS1A05_019T01_9000002672cztM0_level2_bc.evt | modeM0/AS1A05_019T01_9000002672cztM0_level2_quad_clean.evt |
| Size (bytes) | 3,279,487,680 | 1,264,800,960 |
| Size | 3.1 GB | 1.2 GB |
| Events in quadrant A | 22,491,146 | 8,189,148 |
| Events in quadrant B | 21,188,848 | 8,229,016 |
| Events in quadrant C | 20,014,740 | 7,842,761 |
| Events in quadrant D | 29,320,337 | 7,707,899 |
| Mode M0 | |||
|---|---|---|---|
| Quadrant | BADHDUFLAG | Total packets | Discarded packets |
| A | 0 | 203855 | 0 |
| B | 0 | 199989 | 0 |
| C | 0 | 194581 | 0 |
| D | 0 | 227620 | 0 |
| Mode M9 | |||
|---|---|---|---|
| Quadrant | BADHDUFLAG | Total packets | Discarded packets |
| A | 0 | 168 | 0 |
| B | 0 | 168 | 0 |
| C | 0 | 168 | 0 |
| D | 0 | 168 | 0 |
| Mode SS | |||
|---|---|---|---|
| Quadrant | BADHDUFLAG | Total packets | Discarded packets |
| A | 0 | 1886 | 0 |
| B | 0 | 1886 | 0 |
| C | 0 | 1886 | 0 |
| D | 0 | 1886 | 0 |
| Quadrant | Total seconds | Saturated seconds | Saturation percentage |
|---|---|---|---|
| A | 92518 | 1755 | 1.896928% |
| B | 92518 | 1352 | 1.461337% |
| C | 92517 | 1297 | 1.401905% |
| D | 92518 | 3380 | 3.653343% |
Noise dominated data is calculated using 1-second bins in cleaned event files. If a bin has >2000 counts, and if more than 50% of those come from <1% of pixels, then it is considered to be noise-dominated and hence unusable.
| Quadrant | # 1 sec bins | Bins with >0 counts | Bins with >2000 counts | High rate bins dominated by noise | Noise dominated (total time) | Noise dominated (detector-on time) | Marked lightcurve |
|---|---|---|---|---|---|---|---|
| A | 109423 | 92519 | 169 | 169 | 0.15% | 0.18% |  |
| B | 109423 | 92520 | 25 | 25 | 0.02% | 0.03% |  |
| C | 109423 | 92517 | 9 | 9 | 0.01% | 0.01% |  |
| D | 109423 | 92518 | 543 | 543 | 0.50% | 0.59% |  |
Top three noisy pixels from each quadrant. If the there are fewer than three noisy pixels in the level2.evt file, extra rows are filled as -1
| Pixel properties | Quadrant properties | ||||||
|---|---|---|---|---|---|---|---|
| Quadrant | DetID | PixID | Counts | Sigma | Mean | Median | Sigma |
| A | 15 | 174 | 2476153 | 2326.15 | 4898 | 4807 | 1062.4 |
| A | 14 | 237 | 1171070 | 1097.74 | 4898 | 4807 | 1062.4 |
| A | 4 | 2 | 32655 | 26.21 | 4898 | 4807 | 1062.4 |
| B | 7 | 220 | 859441 | 920.7 | 4925 | 4787 | 928.3 |
| B | 0 | 197 | 344056 | 365.49 | 4925 | 4787 | 928.3 |
| B | 5 | 172 | 117968 | 121.93 | 4925 | 4787 | 928.3 |
| C | 3 | 233 | 1643875 | 1498.11 | 4694 | 4679 | 1094.2 |
| C | 0 | 207 | 91306 | 79.17 | 4694 | 4679 | 1094.2 |
| C | 9 | 160 | 87785 | 75.95 | 4694 | 4679 | 1094.2 |
| D | 7 | 238 | 3405389 | 2802.36 | 4771 | 4623 | 1213.5 |
| D | 5 | 222 | 3358795 | 2763.97 | 4771 | 4623 | 1213.5 |
| D | 11 | 176 | 1007289 | 826.24 | 4771 | 4623 | 1213.5 |
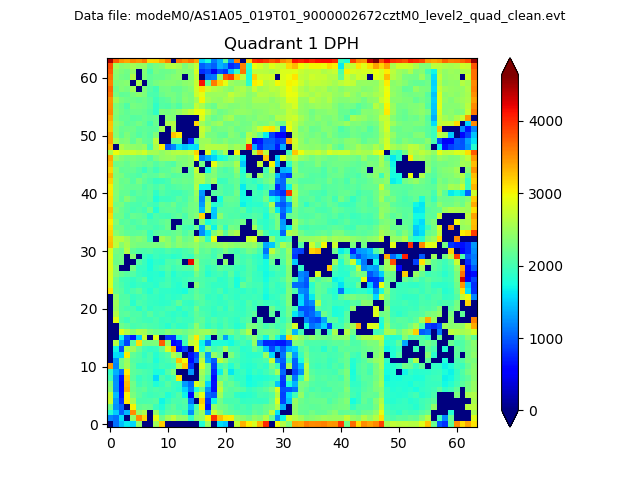
Histogram calculated using DETX and DETY for each event in the final _common_clean file
| Quadrant A |  |
 |
Quadrant B |
|---|---|---|---|
| Quadrant D |  |
 |
Quadrant C |
| Plot type | Count rate plots | Images |
|---|---|---|
| Comparison with Poisson distribution Blue bars denote a histogram of data divided into 1 sec bins. Red curve is a Poisson curve with rate = median count rate of data. |
 |
 |
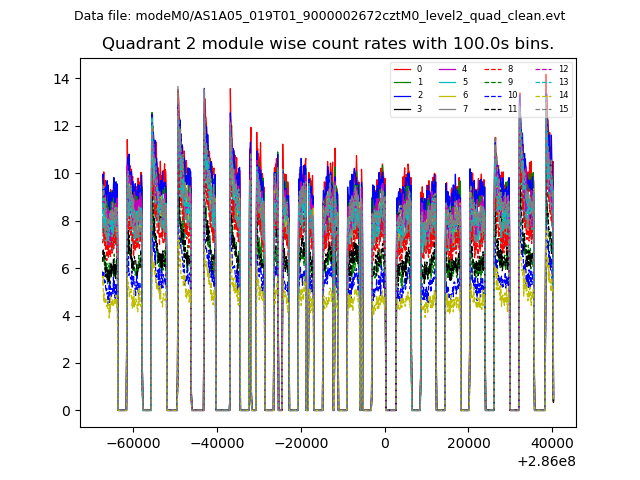
| Quadrant-wise count rates Data is divided into 100 sec bins |
 |
|
| Module-wise count rates for Quadrant A Data is divided into 100 sec bins |
 |
 |
| Module-wise count rates for Quadrant B Data is divided into 100 sec bins |
 |
 |
| Module-wise count rates for Quadrant C Data is divided into 100 sec bins |
 |
 |
| Module-wise count rates for Quadrant D Data is divided into 100 sec bins |
 |
 |
| Parameter | Plot |
|---|---|
| CZT HV Monitor |  |
| D_VDD | 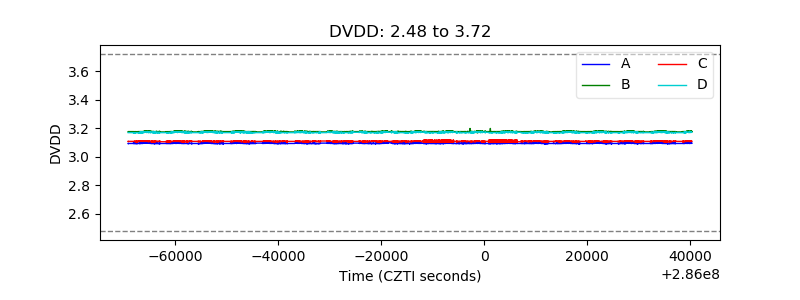 |
| Temperature 1 | 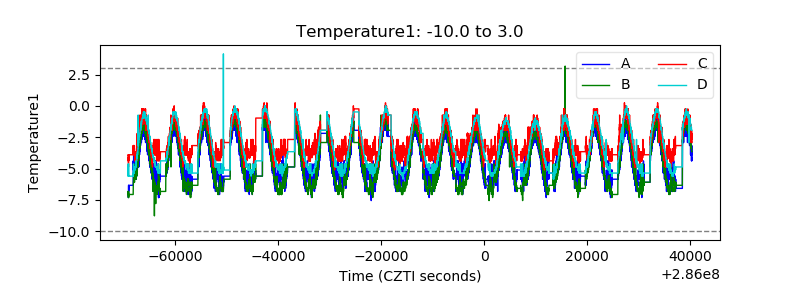 |
| Veto HV Monitor | 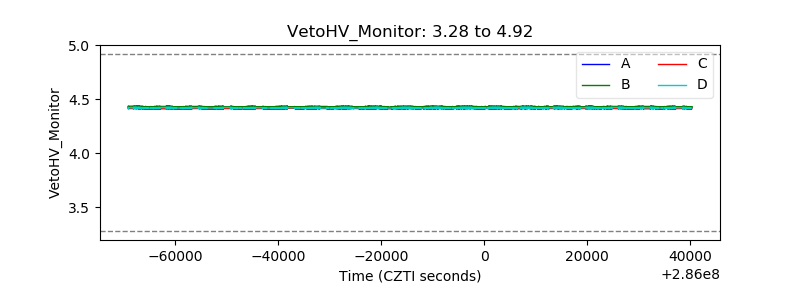 |
| Veto LLD |  |
| Alpha Counter | 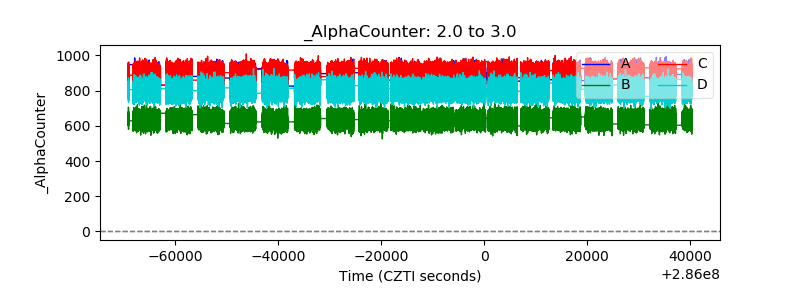 |
| _CPM_Rate |  |
| CZT Counter | 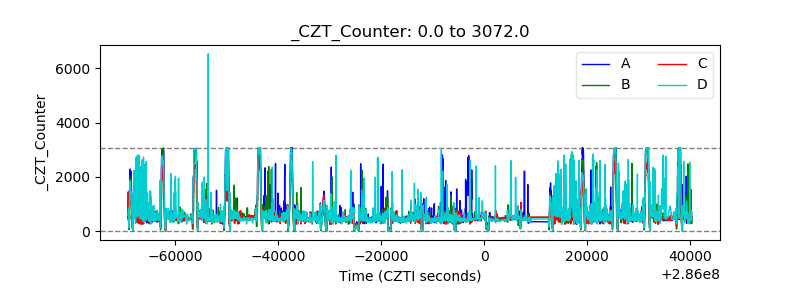 |
| +2.5 Volts monitor |  |
| +5 Volts monitor |  |
| _ROLL_ROT |  |
| _Roll_DEC | 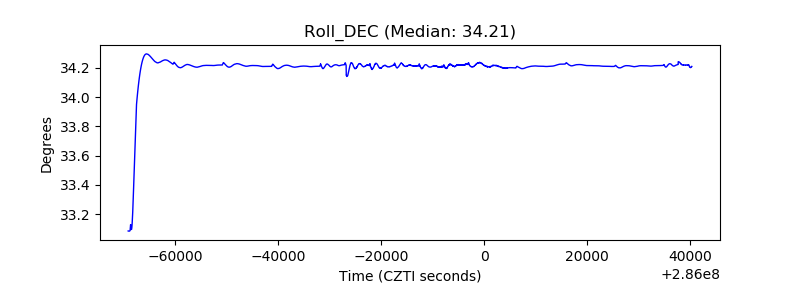 |
| _Roll_RA |  |
| Veto Counter |  |