| Param | Original file | Final file |
|---|---|---|
| Filename | modeM0/AS1A05_096T06_9000002668cztM0_level2_bc.evt | modeM0/AS1A05_096T06_9000002668cztM0_level2_quad_clean.evt |
| Size (bytes) | 2,295,907,200 | 1,145,327,040 |
| Size | 2.1 GB | 1.1 GB |
| Events in quadrant A | 13,899,420 | 7,753,119 |
| Events in quadrant B | 15,658,176 | 7,925,933 |
| Events in quadrant C | 12,851,092 | 7,504,522 |
| Events in quadrant D | 22,728,878 | 7,090,633 |
| Mode M0 | |||
|---|---|---|---|
| Quadrant | BADHDUFLAG | Total packets | Discarded packets |
| A | 0 | 136414 | 0 |
| B | 0 | 141673 | 0 |
| C | 0 | 133547 | 0 |
| D | 0 | 169946 | 0 |
| Mode M9 | |||
|---|---|---|---|
| Quadrant | BADHDUFLAG | Total packets | Discarded packets |
| A | 0 | 103 | 0 |
| B | 0 | 103 | 0 |
| C | 0 | 103 | 0 |
| D | 0 | 103 | 0 |
| Mode SS | |||
|---|---|---|---|
| Quadrant | BADHDUFLAG | Total packets | Discarded packets |
| A | 0 | 1310 | 0 |
| B | 0 | 1310 | 0 |
| C | 0 | 1310 | 0 |
| D | 0 | 1310 | 0 |
| Quadrant | Total seconds | Saturated seconds | Saturation percentage |
|---|---|---|---|
| A | 64442 | 917 | 1.422985% |
| B | 64442 | 1292 | 2.004904% |
| C | 64442 | 942 | 1.461780% |
| D | 64442 | 4286 | 6.650942% |
Noise dominated data is calculated using 1-second bins in cleaned event files. If a bin has >2000 counts, and if more than 50% of those come from <1% of pixels, then it is considered to be noise-dominated and hence unusable.
| Quadrant | # 1 sec bins | Bins with >0 counts | Bins with >2000 counts | High rate bins dominated by noise | Noise dominated (total time) | Noise dominated (detector-on time) | Marked lightcurve |
|---|---|---|---|---|---|---|---|
| A | 74672 | 64437 | 26 | 26 | 0.03% | 0.04% | 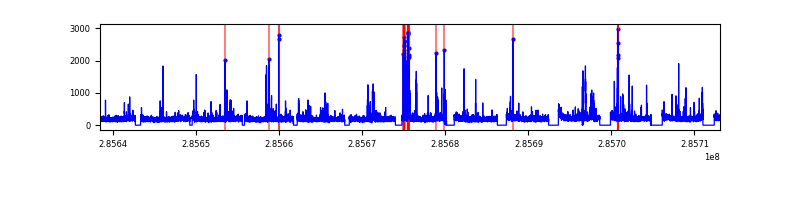 |
| B | 74672 | 64439 | 23 | 23 | 0.03% | 0.04% |  |
| C | 74672 | 64439 | 1 | 1 | 0.00% | 0.00% |  |
| D | 74672 | 64387 | 900 | 900 | 1.21% | 1.40% |  |
Top three noisy pixels from each quadrant. If the there are fewer than three noisy pixels in the level2.evt file, extra rows are filled as -1
| Pixel properties | Quadrant properties | ||||||
|---|---|---|---|---|---|---|---|
| Quadrant | DetID | PixID | Counts | Sigma | Mean | Median | Sigma |
| A | 15 | 174 | 659680 | 898.87 | 3318 | 3259 | 730.3 |
| A | 4 | 2 | 370239 | 502.52 | 3318 | 3259 | 730.3 |
| A | 5 | 168 | 46464 | 59.16 | 3318 | 3259 | 730.3 |
| B | 15 | 222 | 1224780 | 1922.0 | 3367 | 3288 | 635.5 |
| B | 7 | 220 | 302919 | 471.47 | 3367 | 3288 | 635.5 |
| B | 0 | 189 | 255588 | 396.99 | 3367 | 3288 | 635.5 |
| C | 3 | 233 | 489274 | 650.95 | 3182 | 3167 | 746.8 |
| C | 9 | 54 | 40798 | 50.39 | 3182 | 3167 | 746.8 |
| C | 9 | 160 | 40571 | 50.09 | 3182 | 3167 | 746.8 |
| D | 7 | 238 | 5813907 | 7211.53 | 3121 | 3034 | 805.8 |
| D | 5 | 222 | 2688168 | 3332.36 | 3121 | 3034 | 805.8 |
| D | 2 | 165 | 654964 | 809.07 | 3121 | 3034 | 805.8 |
Histogram calculated using DETX and DETY for each event in the final _common_clean file
| Quadrant A |  |
 |
Quadrant B |
|---|---|---|---|
| Quadrant D |  |
 |
Quadrant C |
| Plot type | Count rate plots | Images |
|---|---|---|
| Comparison with Poisson distribution Blue bars denote a histogram of data divided into 1 sec bins. Red curve is a Poisson curve with rate = median count rate of data. |
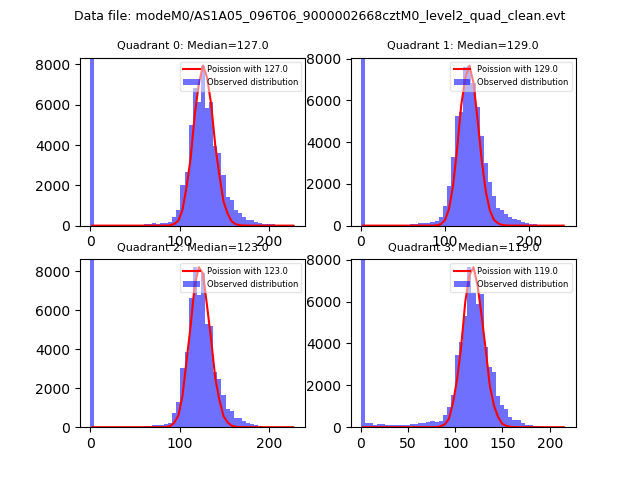 |
 |
| Quadrant-wise count rates Data is divided into 100 sec bins |
 |
|
| Module-wise count rates for Quadrant A Data is divided into 100 sec bins |
 |
 |
| Module-wise count rates for Quadrant B Data is divided into 100 sec bins |
 |
 |
| Module-wise count rates for Quadrant C Data is divided into 100 sec bins |
 |
 |
| Module-wise count rates for Quadrant D Data is divided into 100 sec bins |
 |
 |
| Parameter | Plot |
|---|---|
| CZT HV Monitor |  |
| D_VDD |  |
| Temperature 1 |  |
| Veto HV Monitor |  |
| Veto LLD |  |
| Alpha Counter |  |
| _CPM_Rate |  |
| CZT Counter |  |
| +2.5 Volts monitor |  |
| +5 Volts monitor | 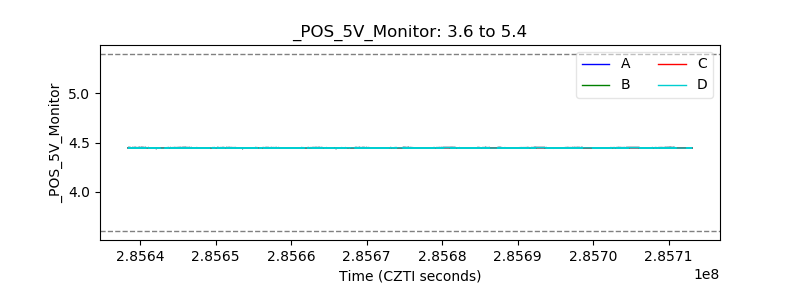 |
| _ROLL_ROT |  |
| _Roll_DEC |  |
| _Roll_RA |  |
| Veto Counter | 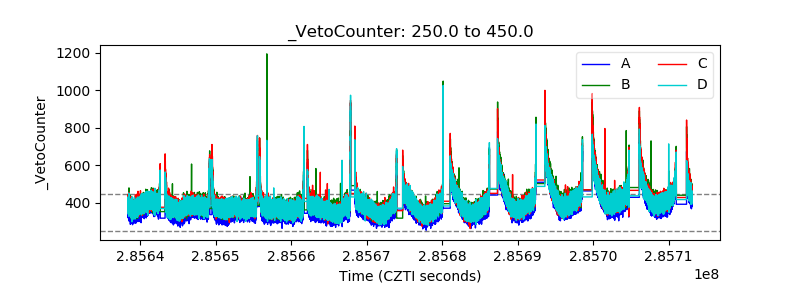 |