| Param | Original file | Final file |
|---|---|---|
| Filename | modeM0/AS1T03_075T01_9000002660cztM0_level2_bc.evt | modeM0/AS1T03_075T01_9000002660cztM0_level2_quad_clean.evt |
| Size (bytes) | 3,667,694,400 | 1,524,015,360 |
| Size | 3.4 GB | 1.4 GB |
| Events in quadrant A | 23,710,167 | 9,584,009 |
| Events in quadrant B | 24,958,067 | 9,858,094 |
| Events in quadrant C | 24,053,861 | 9,480,279 |
| Events in quadrant D | 30,428,614 | 9,273,048 |
| Mode M9 | |||
|---|---|---|---|
| Quadrant | BADHDUFLAG | Total packets | Discarded packets |
| A | 0 | 172 | 0 |
| B | 0 | 172 | 0 |
| C | 0 | 172 | 0 |
| D | 0 | 172 | 0 |
| Mode SS | |||
|---|---|---|---|
| Quadrant | BADHDUFLAG | Total packets | Discarded packets |
| A | 0 | 2370 | 0 |
| B | 0 | 2370 | 0 |
| C | 0 | 2370 | 0 |
| D | 0 | 2370 | 0 |
| Mode M0 | |||
|---|---|---|---|
| Quadrant | BADHDUFLAG | Total packets | Discarded packets |
| A | 0 | 242644 | 0 |
| B | 0 | 246356 | 0 |
| C | 0 | 245231 | 0 |
| D | 0 | 265449 | 0 |
| Quadrant | Total seconds | Saturated seconds | Saturation percentage |
|---|---|---|---|
| A | 116243 | 1640 | 1.410838% |
| B | 116243 | 2023 | 1.740320% |
| C | 116243 | 2255 | 1.939902% |
| D | 116243 | 2948 | 2.536067% |
Noise dominated data is calculated using 1-second bins in cleaned event files. If a bin has >2000 counts, and if more than 50% of those come from <1% of pixels, then it is considered to be noise-dominated and hence unusable.
| Quadrant | # 1 sec bins | Bins with >0 counts | Bins with >2000 counts | High rate bins dominated by noise | Noise dominated (total time) | Noise dominated (detector-on time) | Marked lightcurve |
|---|---|---|---|---|---|---|---|
| A | 133683 | 116251 | 6 | 6 | 0.00% | 0.01% |  |
| B | 133683 | 116244 | 9 | 9 | 0.01% | 0.01% | 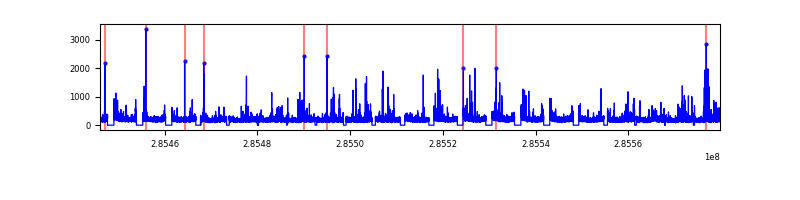 |
| C | 133683 | 116247 | 10 | 10 | 0.01% | 0.01% |  |
| D | 133683 | 116240 | 268 | 268 | 0.20% | 0.23% |  |
Top three noisy pixels from each quadrant. If the there are fewer than three noisy pixels in the level2.evt file, extra rows are filled as -1
| Pixel properties | Quadrant properties | ||||||
|---|---|---|---|---|---|---|---|
| Quadrant | DetID | PixID | Counts | Sigma | Mean | Median | Sigma |
| A | 15 | 174 | 241290 | 179.11 | 6062 | 5943 | 1314.0 |
| A | 6 | 16 | 188470 | 138.91 | 6062 | 5943 | 1314.0 |
| A | 12 | 194 | 39310 | 25.39 | 6062 | 5943 | 1314.0 |
| B | 0 | 189 | 237803 | 199.97 | 6177 | 6010 | 1159.1 |
| B | 15 | 222 | 223165 | 187.34 | 6177 | 6010 | 1159.1 |
| B | 4 | 216 | 132807 | 109.39 | 6177 | 6010 | 1159.1 |
| C | 3 | 233 | 1009718 | 733.4 | 5919 | 5889 | 1368.7 |
| C | 9 | 54 | 119554 | 83.04 | 5919 | 5889 | 1368.7 |
| C | 5 | 218 | 97955 | 67.26 | 5919 | 5889 | 1368.7 |
| D | 7 | 238 | 4134016 | 2762.75 | 5939 | 5751 | 1494.3 |
| D | 12 | 110 | 753157 | 500.18 | 5939 | 5751 | 1494.3 |
| D | 13 | 168 | 566183 | 375.06 | 5939 | 5751 | 1494.3 |
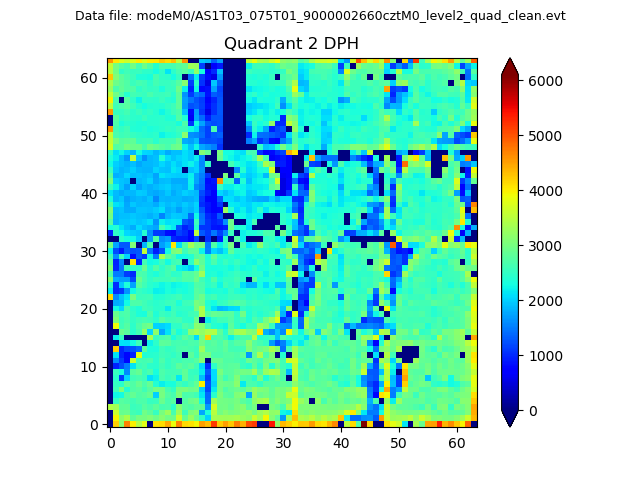
Histogram calculated using DETX and DETY for each event in the final _common_clean file
| Quadrant A |  |
 |
Quadrant B |
|---|---|---|---|
| Quadrant D | 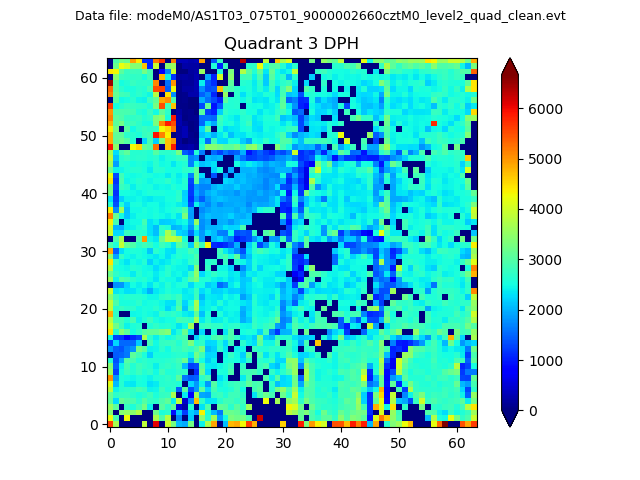 |
 |
Quadrant C |
| Plot type | Count rate plots | Images |
|---|---|---|
| Comparison with Poisson distribution Blue bars denote a histogram of data divided into 1 sec bins. Red curve is a Poisson curve with rate = median count rate of data. |
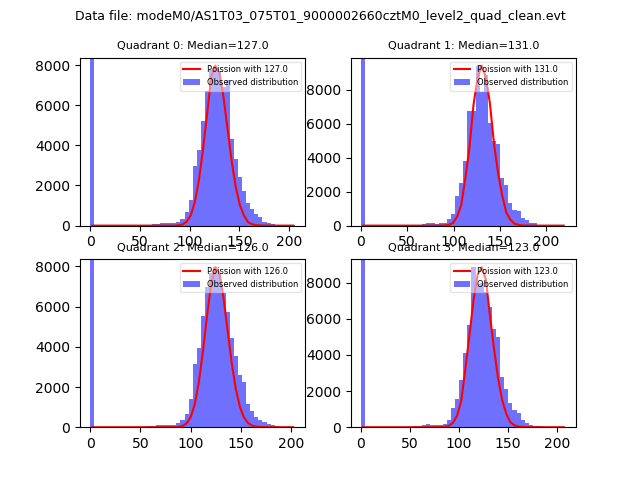 |
 |
| Quadrant-wise count rates Data is divided into 100 sec bins |
 |
|
| Module-wise count rates for Quadrant A Data is divided into 100 sec bins |
 |
 |
| Module-wise count rates for Quadrant B Data is divided into 100 sec bins |
 |
 |
| Module-wise count rates for Quadrant C Data is divided into 100 sec bins |
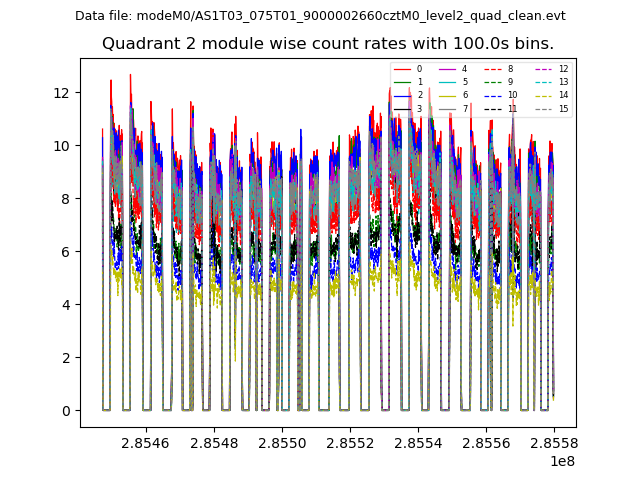 |
 |
| Module-wise count rates for Quadrant D Data is divided into 100 sec bins |
 |
 |
| Parameter | Plot |
|---|---|
| CZT HV Monitor |  |
| D_VDD |  |
| Temperature 1 | 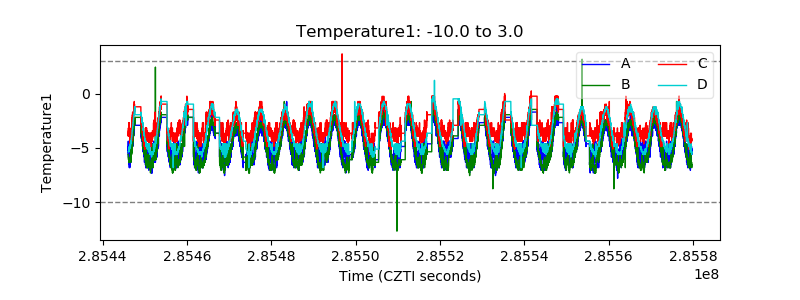 |
| Veto HV Monitor |  |
| Veto LLD |  |
| Alpha Counter |  |
| _CPM_Rate | 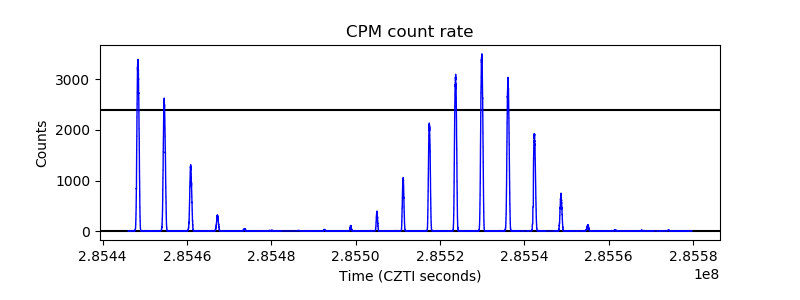 |
| CZT Counter |  |
| +2.5 Volts monitor | 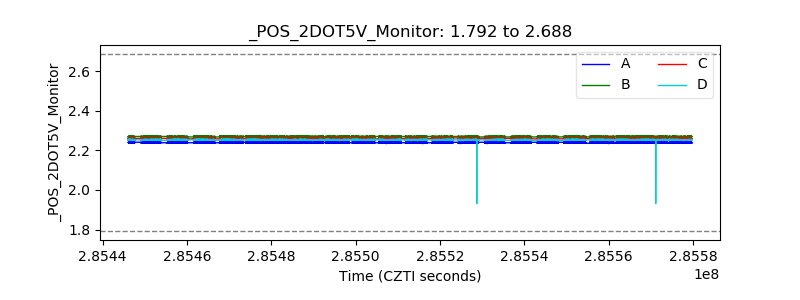 |
| +5 Volts monitor |  |
| _ROLL_ROT | 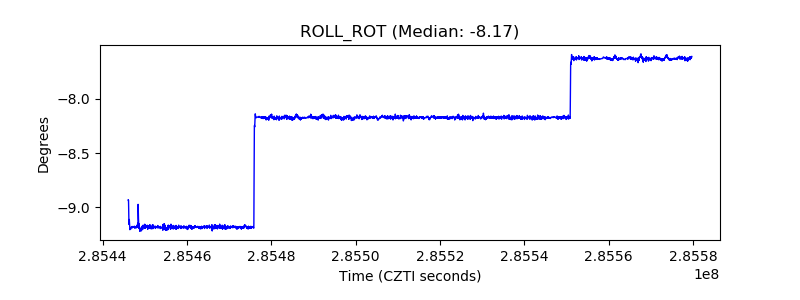 |
| _Roll_DEC |  |
| _Roll_RA |  |
| Veto Counter | 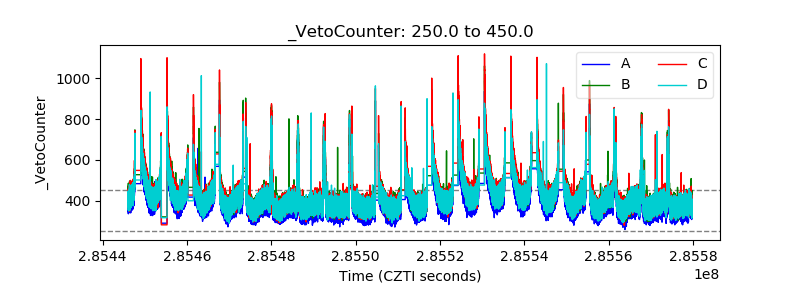 |