| Param | Original file | Final file |
|---|---|---|
| Filename | modeM0/AS1T03_061T01_9000002654cztM0_level2_bc.evt | modeM0/AS1T03_061T01_9000002654cztM0_level2_quad_clean.evt |
| Size (bytes) | 908,300,160 | 362,923,200 |
| Size | 866.2 MB | 346.1 MB |
| Events in quadrant A | 5,376,408 | 2,311,297 |
| Events in quadrant B | 6,232,872 | 2,301,855 |
| Events in quadrant C | 5,613,524 | 2,251,904 |
| Events in quadrant D | 8,361,117 | 2,194,031 |
| Mode M9 | |||
|---|---|---|---|
| Quadrant | BADHDUFLAG | Total packets | Discarded packets |
| A | 0 | 19 | 0 |
| B | 0 | 19 | 0 |
| C | 0 | 19 | 0 |
| D | 0 | 19 | 0 |
| Mode SS | |||
|---|---|---|---|
| Quadrant | BADHDUFLAG | Total packets | Discarded packets |
| A | 0 | 572 | 0 |
| B | 0 | 572 | 0 |
| C | 0 | 572 | 0 |
| D | 0 | 572 | 0 |
| Mode M0 | |||
|---|---|---|---|
| Quadrant | BADHDUFLAG | Total packets | Discarded packets |
| A | 0 | 58065 | 0 |
| B | 0 | 61777 | 0 |
| C | 0 | 58295 | 0 |
| D | 0 | 70435 | 0 |
| Quadrant | Total seconds | Saturated seconds | Saturation percentage |
|---|---|---|---|
| A | 28115 | 548 | 1.949137% |
| B | 28115 | 1030 | 3.663525% |
| C | 28115 | 694 | 2.468433% |
| D | 28115 | 1555 | 5.530855% |
Noise dominated data is calculated using 1-second bins in cleaned event files. If a bin has >2000 counts, and if more than 50% of those come from <1% of pixels, then it is considered to be noise-dominated and hence unusable.
| Quadrant | # 1 sec bins | Bins with >0 counts | Bins with >2000 counts | High rate bins dominated by noise | Noise dominated (total time) | Noise dominated (detector-on time) | Marked lightcurve |
|---|---|---|---|---|---|---|---|
| A | 30000 | 28115 | 1 | 1 | 0.00% | 0.00% |  |
| B | 30000 | 28112 | 1 | 1 | 0.00% | 0.00% |  |
| C | 30000 | 28117 | 0 | 0 | 0.00% | 0.00% | 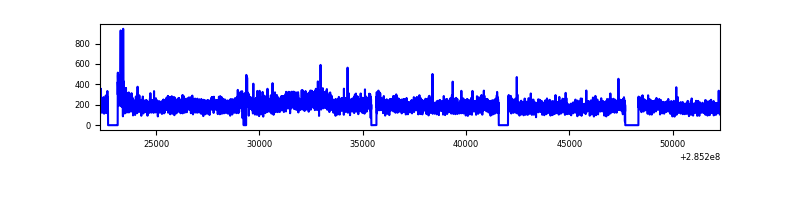 |
| D | 30000 | 28114 | 47 | 47 | 0.16% | 0.17% |  |
Top three noisy pixels from each quadrant. If the there are fewer than three noisy pixels in the level2.evt file, extra rows are filled as -1
| Pixel properties | Quadrant properties | ||||||
|---|---|---|---|---|---|---|---|
| Quadrant | DetID | PixID | Counts | Sigma | Mean | Median | Sigma |
| A | 15 | 174 | 84411 | 270.33 | 1380 | 1348 | 307.3 |
| A | 12 | 194 | 8808 | 24.28 | 1380 | 1348 | 307.3 |
| A | 0 | 226 | 8716 | 23.98 | 1380 | 1348 | 307.3 |
| B | 15 | 222 | 756504 | 2877.72 | 1379 | 1340 | 262.4 |
| B | 15 | 33 | 88396 | 331.75 | 1379 | 1340 | 262.4 |
| B | 4 | 80 | 30359 | 110.58 | 1379 | 1340 | 262.4 |
| C | 13 | 62 | 288119 | 904.23 | 1343 | 1324 | 317.2 |
| C | 5 | 218 | 72611 | 224.76 | 1343 | 1324 | 317.2 |
| C | 9 | 54 | 30534 | 92.1 | 1343 | 1324 | 317.2 |
| D | 7 | 238 | 2836741 | 9044.6 | 1343 | 1291 | 313.5 |
| D | 10 | 70 | 140894 | 445.31 | 1343 | 1291 | 313.5 |
| D | 2 | 234 | 116402 | 367.18 | 1343 | 1291 | 313.5 |
Histogram calculated using DETX and DETY for each event in the final _common_clean file
| Quadrant A |  |
 |
Quadrant B |
|---|---|---|---|
| Quadrant D |  |
 |
Quadrant C |
| Plot type | Count rate plots | Images |
|---|---|---|
| Comparison with Poisson distribution Blue bars denote a histogram of data divided into 1 sec bins. Red curve is a Poisson curve with rate = median count rate of data. |
 |
 |
| Quadrant-wise count rates Data is divided into 100 sec bins |
 |
|
| Module-wise count rates for Quadrant A Data is divided into 100 sec bins |
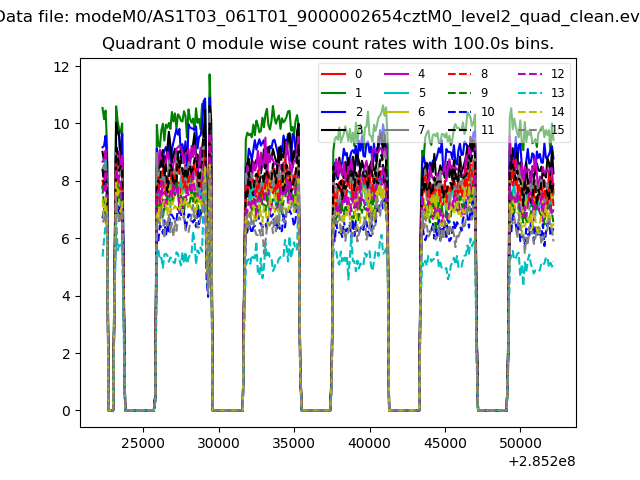 |
 |
| Module-wise count rates for Quadrant B Data is divided into 100 sec bins |
 |
 |
| Module-wise count rates for Quadrant C Data is divided into 100 sec bins |
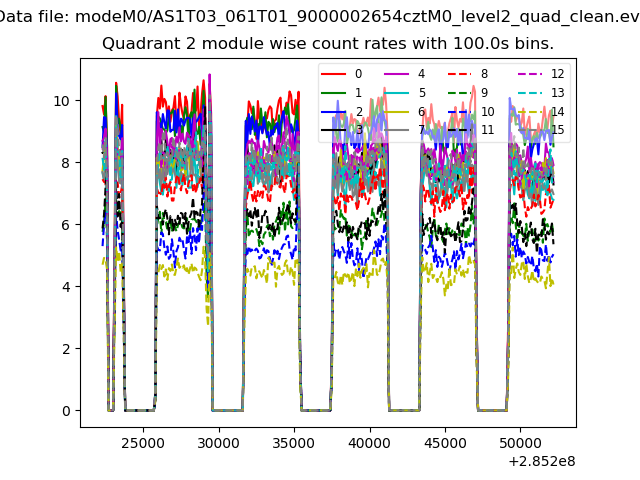 |
 |
| Module-wise count rates for Quadrant D Data is divided into 100 sec bins |
 |
 |
| Parameter | Plot |
|---|---|
| CZT HV Monitor |  |
| D_VDD |  |
| Temperature 1 |  |
| Veto HV Monitor |  |
| Veto LLD |  |
| Alpha Counter |  |
| _CPM_Rate |  |
| CZT Counter |  |
| +2.5 Volts monitor |  |
| +5 Volts monitor |  |
| _ROLL_ROT |  |
| _Roll_DEC |  |
| _Roll_RA |  |
| Veto Counter | 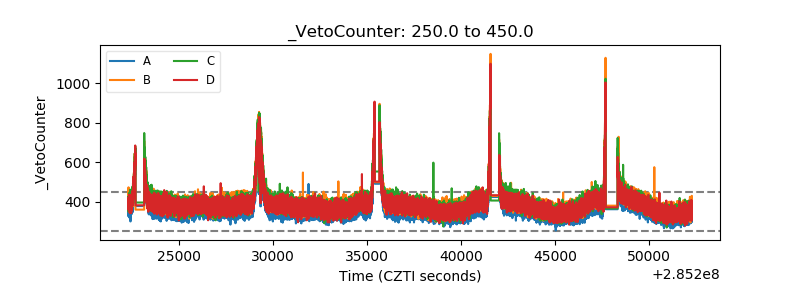 |