| Param | Original file | Final file |
|---|---|---|
| Filename | modeM0/AS1A05_085T01_9000002658cztM0_level2_bc.evt | modeM0/AS1A05_085T01_9000002658cztM0_level2_quad_clean.evt |
| Size (bytes) | 4,851,077,760 | 1,950,128,640 |
| Size | 4.5 GB | 1.8 GB |
| Events in quadrant A | 29,781,718 | 12,574,550 |
| Events in quadrant B | 30,398,243 | 12,686,266 |
| Events in quadrant C | 29,744,229 | 12,148,326 |
| Events in quadrant D | 47,026,010 | 11,641,826 |
| Mode SS | |||
|---|---|---|---|
| Quadrant | BADHDUFLAG | Total packets | Discarded packets |
| A | 0 | 2980 | 0 |
| B | 0 | 2980 | 0 |
| C | 0 | 2980 | 0 |
| D | 0 | 2980 | 0 |
| Mode M9 | |||
|---|---|---|---|
| Quadrant | BADHDUFLAG | Total packets | Discarded packets |
| A | 0 | 233 | 0 |
| B | 0 | 233 | 0 |
| C | 0 | 233 | 0 |
| D | 0 | 233 | 0 |
| Mode M0 | |||
|---|---|---|---|
| Quadrant | BADHDUFLAG | Total packets | Discarded packets |
| A | 0 | 303111 | 0 |
| B | 0 | 304649 | 0 |
| C | 0 | 303391 | 0 |
| D | 0 | 369857 | 0 |
| Quadrant | Total seconds | Saturated seconds | Saturation percentage |
|---|---|---|---|
| A | 146221 | 1688 | 1.154417% |
| B | 146221 | 2081 | 1.423188% |
| C | 146221 | 2322 | 1.588007% |
| D | 146221 | 7831 | 5.355592% |
Noise dominated data is calculated using 1-second bins in cleaned event files. If a bin has >2000 counts, and if more than 50% of those come from <1% of pixels, then it is considered to be noise-dominated and hence unusable.
| Quadrant | # 1 sec bins | Bins with >0 counts | Bins with >2000 counts | High rate bins dominated by noise | Noise dominated (total time) | Noise dominated (detector-on time) | Marked lightcurve |
|---|---|---|---|---|---|---|---|
| A | 169611 | 146215 | 11 | 11 | 0.01% | 0.01% |  |
| B | 169611 | 146215 | 3 | 3 | 0.00% | 0.00% |  |
| C | 169611 | 146220 | 1 | 1 | 0.00% | 0.00% | 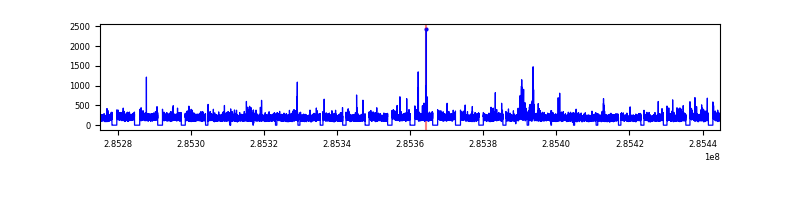 |
| D | 169611 | 146218 | 1250 | 1250 | 0.74% | 0.85% |  |
Top three noisy pixels from each quadrant. If the there are fewer than three noisy pixels in the level2.evt file, extra rows are filled as -1
| Pixel properties | Quadrant properties | ||||||
|---|---|---|---|---|---|---|---|
| Quadrant | DetID | PixID | Counts | Sigma | Mean | Median | Sigma |
| A | 6 | 16 | 496056 | 292.11 | 7606 | 7450 | 1672.7 |
| A | 15 | 174 | 154463 | 87.89 | 7606 | 7450 | 1672.7 |
| A | 0 | 226 | 49549 | 25.17 | 7606 | 7450 | 1672.7 |
| B | 15 | 222 | 231664 | 154.01 | 7704 | 7491 | 1455.6 |
| B | 0 | 183 | 224980 | 149.41 | 7704 | 7491 | 1455.6 |
| B | 0 | 219 | 89649 | 56.44 | 7704 | 7491 | 1455.6 |
| C | 3 | 233 | 740848 | 428.41 | 7338 | 7282 | 1712.3 |
| C | 5 | 218 | 557303 | 321.22 | 7338 | 7282 | 1712.3 |
| C | 5 | 219 | 104210 | 56.61 | 7338 | 7282 | 1712.3 |
| D | 7 | 238 | 16476722 | 8817.79 | 7217 | 7006 | 1867.8 |
| D | 1 | 52 | 830379 | 440.83 | 7217 | 7006 | 1867.8 |
| D | 12 | 227 | 680684 | 360.68 | 7217 | 7006 | 1867.8 |
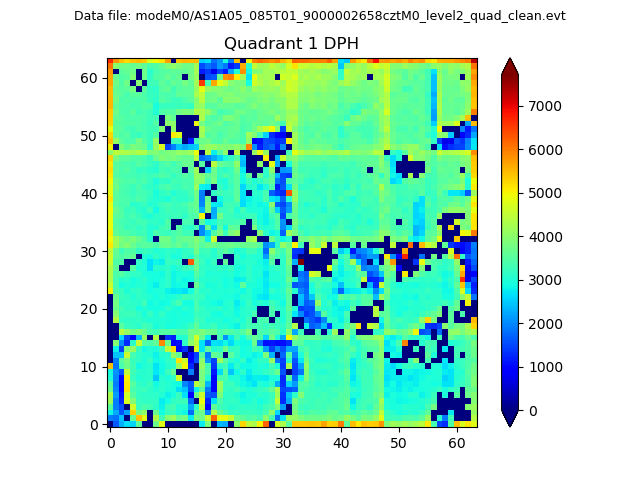
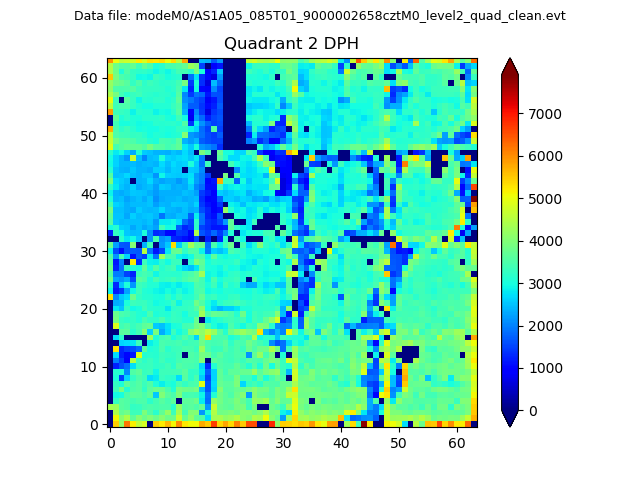
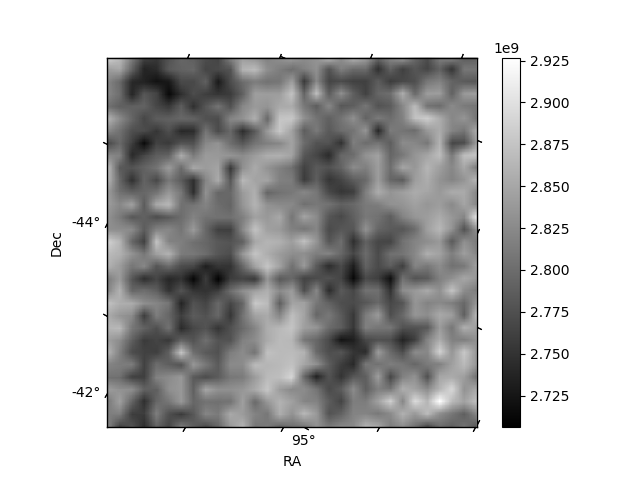
Histogram calculated using DETX and DETY for each event in the final _common_clean file
| Quadrant A |  |
 |
Quadrant B |
|---|---|---|---|
| Quadrant D |  |
 |
Quadrant C |
| Plot type | Count rate plots | Images |
|---|---|---|
| Comparison with Poisson distribution Blue bars denote a histogram of data divided into 1 sec bins. Red curve is a Poisson curve with rate = median count rate of data. |
 |
 |
| Quadrant-wise count rates Data is divided into 100 sec bins |
 |
|
| Module-wise count rates for Quadrant A Data is divided into 100 sec bins |
 |
 |
| Module-wise count rates for Quadrant B Data is divided into 100 sec bins |
 |
 |
| Module-wise count rates for Quadrant C Data is divided into 100 sec bins |
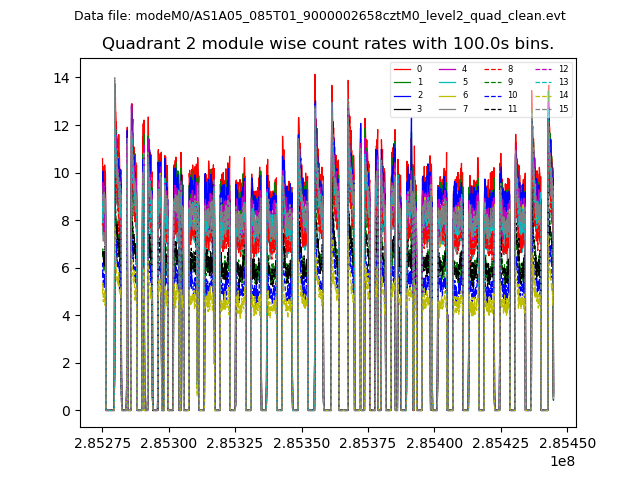 |
 |
| Module-wise count rates for Quadrant D Data is divided into 100 sec bins |
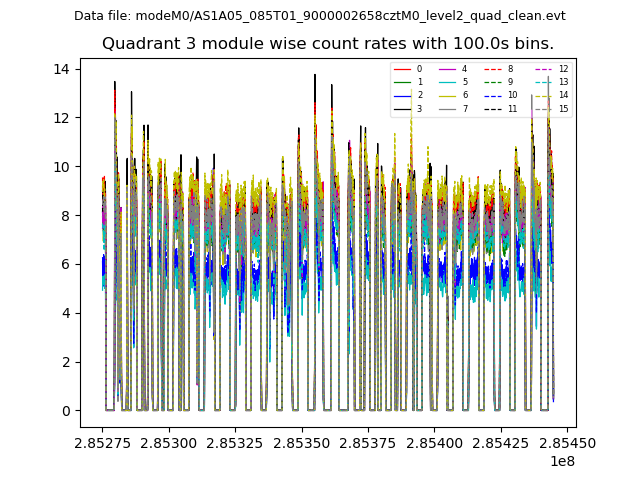 |
 |
| Parameter | Plot |
|---|---|
| CZT HV Monitor |  |
| D_VDD |  |
| Temperature 1 |  |
| Veto HV Monitor |  |
| Veto LLD | 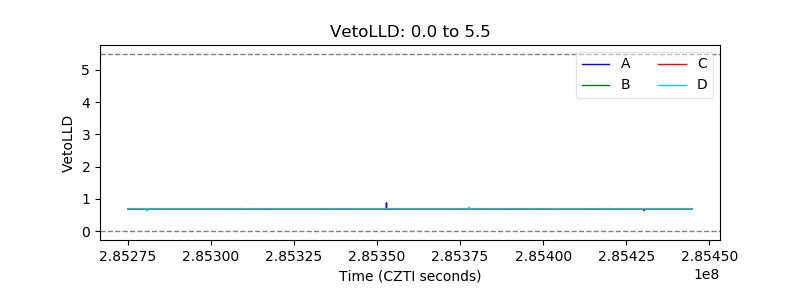 |
| Alpha Counter | 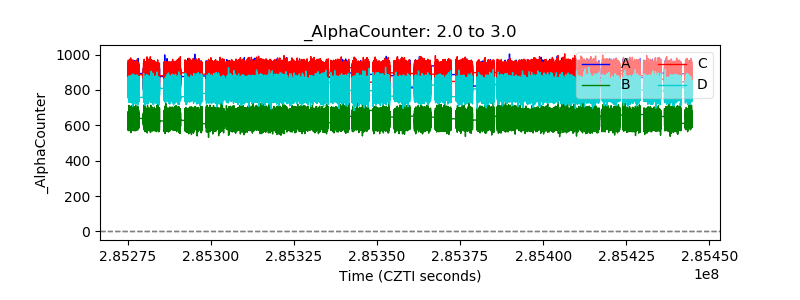 |
| _CPM_Rate |  |
| CZT Counter |  |
| +2.5 Volts monitor |  |
| +5 Volts monitor |  |
| _ROLL_ROT | 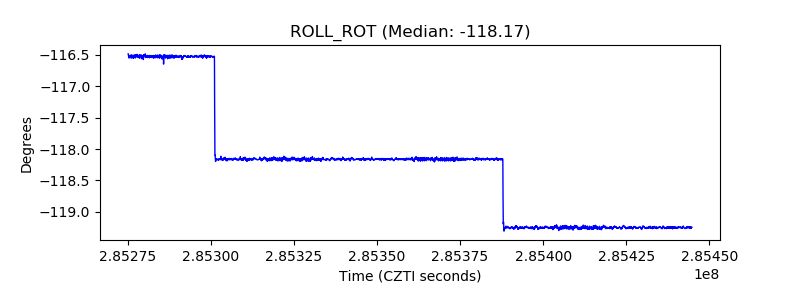 |
| _Roll_DEC |  |
| _Roll_RA |  |
| Veto Counter |  |