| Param | Original file | Final file |
|---|---|---|
| Filename | modeM0/AS1A05_025T04_9000002652cztM0_level2.evt | modeM0/AS1A05_025T04_9000002652cztM0_level2_quad_clean.evt |
| Size (bytes) | 1,855,941,120 | 328,510,080 |
| Size | 1.7 GB | 313.3 MB |
| Events in quadrant A | 13,005,373 | 2,059,996 |
| Events in quadrant B | 13,366,185 | 2,117,055 |
| Events in quadrant C | 13,166,767 | 2,032,695 |
| Events in quadrant D | 14,916,508 | 1,954,929 |
| Mode SS | |||
|---|---|---|---|
| Quadrant | BADHDUFLAG | Total packets | Discarded packets |
| A | 0 | 532 | 0 |
| B | 0 | 532 | 0 |
| C | 0 | 532 | 0 |
| D | 0 | 532 | 0 |
| Mode M0 | |||
|---|---|---|---|
| Quadrant | BADHDUFLAG | Total packets | Discarded packets |
| A | 0 | 55440 | 0 |
| B | 0 | 55824 | 0 |
| C | 0 | 54509 | 0 |
| D | 0 | 61908 | 0 |
| Mode M9 | |||
|---|---|---|---|
| Quadrant | BADHDUFLAG | Total packets | Discarded packets |
| A | 0 | 61 | 0 |
| B | 0 | 61 | 0 |
| C | 0 | 61 | 0 |
| D | 0 | 61 | 0 |
| Quadrant | Total seconds | Saturated seconds | Saturation percentage |
|---|---|---|---|
| A | 25946 | 297 | 1.144685% |
| B | 25946 | 303 | 1.167810% |
| C | 25946 | 266 | 1.025206% |
| D | 25946 | 517 | 1.992600% |
Noise dominated data is calculated using 1-second bins in cleaned event files. If a bin has >2000 counts, and if more than 50% of those come from <1% of pixels, then it is considered to be noise-dominated and hence unusable.
| Quadrant | # 1 sec bins | Bins with >0 counts | Bins with >2000 counts | High rate bins dominated by noise | Noise dominated (total time) | Noise dominated (detector-on time) | Marked lightcurve |
|---|---|---|---|---|---|---|---|
| A | 32131 | 25952 | 173 | 173 | 0.54% | 0.67% |  |
| B | 32131 | 25952 | 76 | 76 | 0.24% | 0.29% | 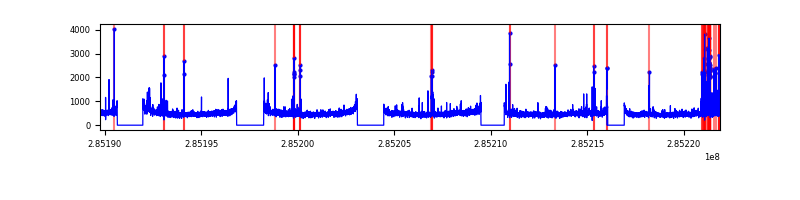 |
| C | 32131 | 25952 | 0 | 0 | 0.00% | 0.00% | 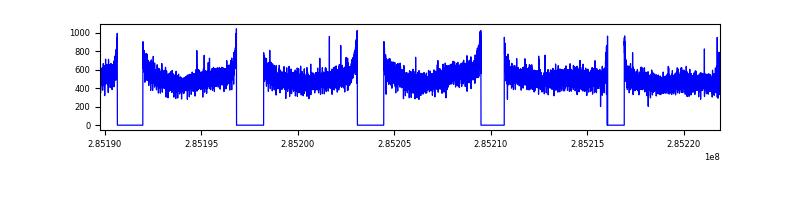 |
| D | 32131 | 25952 | 375 | 375 | 1.17% | 1.44% |  |
Top three noisy pixels from each quadrant. If the there are fewer than three noisy pixels in the level2.evt file, extra rows are filled as -1
| Pixel properties | Quadrant properties | ||||||
|---|---|---|---|---|---|---|---|
| Quadrant | DetID | PixID | Counts | Sigma | Mean | Median | Sigma |
| A | 15 | 174 | 699907 | 1093.74 | 3204 | 3144 | 637.0 |
| A | 0 | 226 | 27679 | 38.51 | 3204 | 3144 | 637.0 |
| A | 3 | 137 | 23986 | 32.72 | 3204 | 3144 | 637.0 |
| B | 10 | 245 | 451569 | 745.83 | 3237 | 3161 | 601.2 |
| B | 15 | 222 | 109575 | 177.0 | 3237 | 3161 | 601.2 |
| B | 12 | 111 | 72319 | 115.03 | 3237 | 3161 | 601.2 |
| C | 14 | 238 | 489457 | 675.94 | 3123 | 3151 | 719.4 |
| C | 13 | 62 | 395211 | 544.95 | 3123 | 3151 | 719.4 |
| C | 5 | 218 | 98654 | 132.74 | 3123 | 3151 | 719.4 |
| D | 7 | 238 | 2581291 | 3154.73 | 3086 | 3031 | 817.3 |
| D | 10 | 70 | 220082 | 265.58 | 3086 | 3031 | 817.3 |
| D | 12 | 110 | 136729 | 163.59 | 3086 | 3031 | 817.3 |
Histogram calculated using DETX and DETY for each event in the final _common_clean file
| Quadrant A |  |
 |
Quadrant B |
|---|---|---|---|
| Quadrant D | 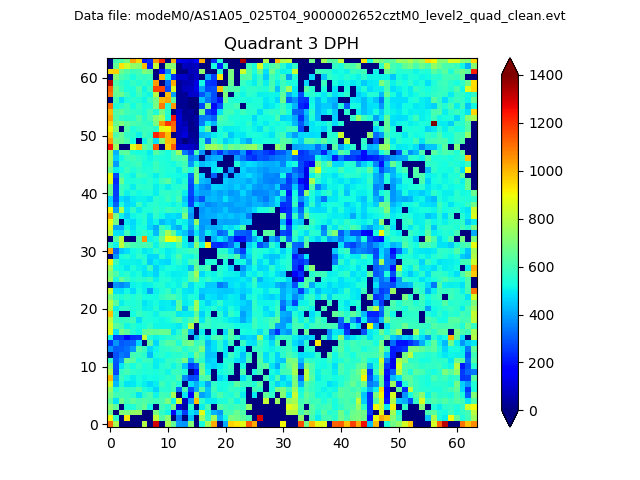 |
 |
Quadrant C |
| Plot type | Count rate plots | Images |
|---|---|---|
| Comparison with Poisson distribution Blue bars denote a histogram of data divided into 1 sec bins. Red curve is a Poisson curve with rate = median count rate of data. |
 |
 |
| Quadrant-wise count rates Data is divided into 100 sec bins |
 |
|
| Module-wise count rates for Quadrant A Data is divided into 100 sec bins |
 |
 |
| Module-wise count rates for Quadrant B Data is divided into 100 sec bins |
 |
 |
| Module-wise count rates for Quadrant C Data is divided into 100 sec bins |
 |
 |
| Module-wise count rates for Quadrant D Data is divided into 100 sec bins |
 |
 |
| Parameter | Plot |
|---|---|
| CZT HV Monitor |  |
| D_VDD |  |
| Temperature 1 |  |
| Veto HV Monitor | 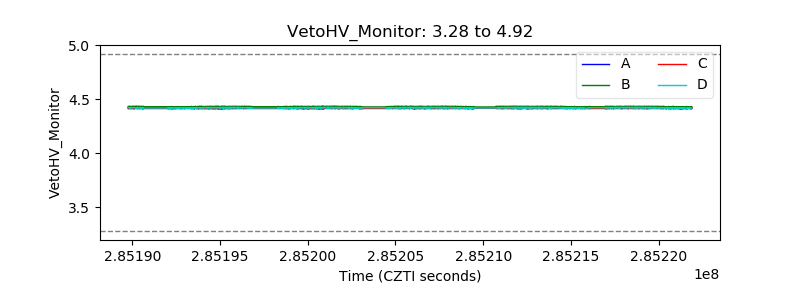 |
| Veto LLD | 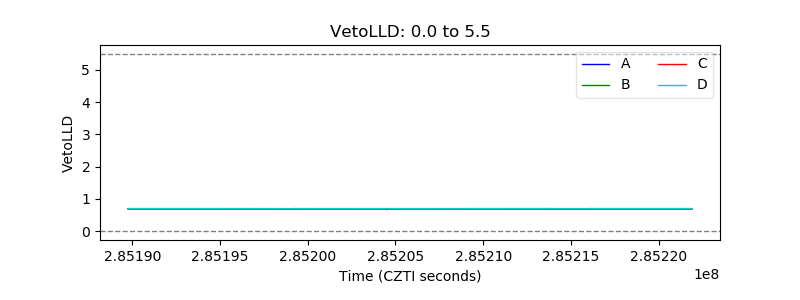 |
| Alpha Counter |  |
| _CPM_Rate |  |
| CZT Counter |  |
| +2.5 Volts monitor |  |
| +5 Volts monitor |  |
| _ROLL_ROT | 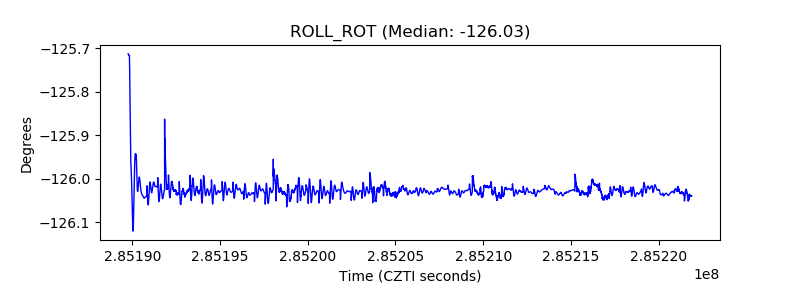 |
| _Roll_DEC | 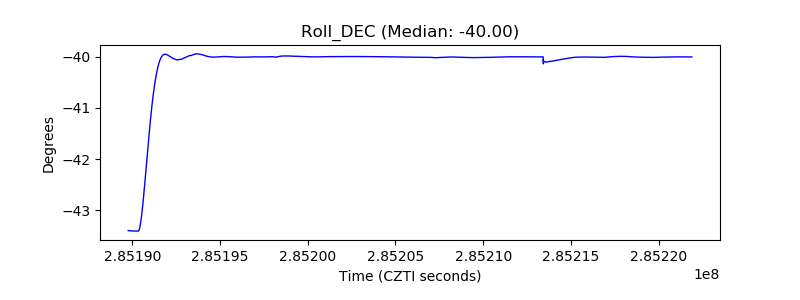 |
| _Roll_RA | 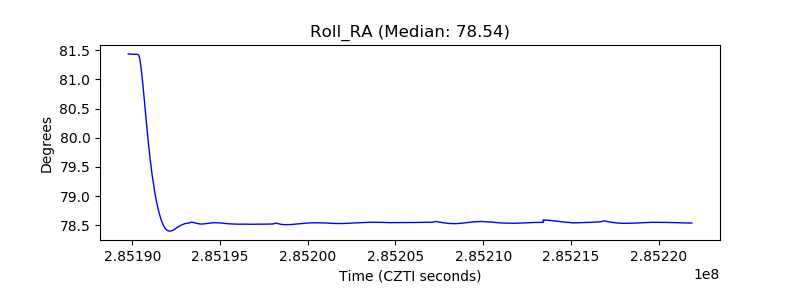 |
| Veto Counter | 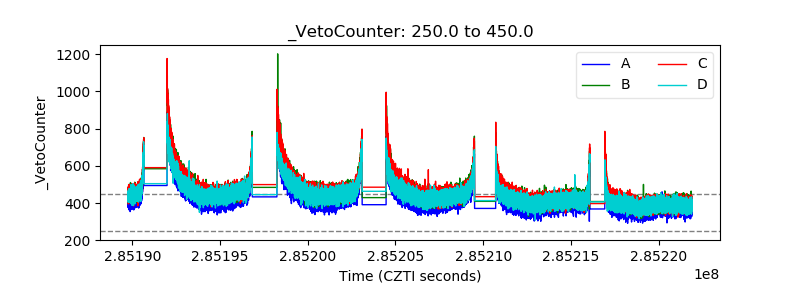 |