| Param | Original file | Final file |
|---|---|---|
| Filename | modeM0/AS1T03_070T09_9000002648cztM0_level2_bc.evt | modeM0/AS1T03_070T09_9000002648cztM0_level2_quad_clean.evt |
| Size (bytes) | 647,208,000 | 229,559,040 |
| Size | 617.2 MB | 218.9 MB |
| Events in quadrant A | 3,827,030 | 1,438,318 |
| Events in quadrant B | 4,411,029 | 1,457,055 |
| Events in quadrant C | 4,986,195 | 1,363,411 |
| Events in quadrant D | 5,064,512 | 1,374,524 |
| Mode M9 | |||
|---|---|---|---|
| Quadrant | BADHDUFLAG | Total packets | Discarded packets |
| A | 0 | 29 | 0 |
| B | 0 | 29 | 0 |
| C | 0 | 29 | 0 |
| D | 0 | 29 | 0 |
| Mode M0 | |||
|---|---|---|---|
| Quadrant | BADHDUFLAG | Total packets | Discarded packets |
| A | 0 | 39185 | 0 |
| B | 0 | 40984 | 0 |
| C | 0 | 43719 | 0 |
| D | 0 | 43411 | 0 |
| Mode SS | |||
|---|---|---|---|
| Quadrant | BADHDUFLAG | Total packets | Discarded packets |
| A | 0 | 390 | 0 |
| B | 0 | 390 | 0 |
| C | 0 | 390 | 0 |
| D | 0 | 390 | 0 |
| Quadrant | Total seconds | Saturated seconds | Saturation percentage |
|---|---|---|---|
| A | 19144 | 164 | 0.856665% |
| B | 19144 | 267 | 1.394693% |
| C | 19144 | 820 | 4.283326% |
| D | 19144 | 493 | 2.575219% |
Noise dominated data is calculated using 1-second bins in cleaned event files. If a bin has >2000 counts, and if more than 50% of those come from <1% of pixels, then it is considered to be noise-dominated and hence unusable.
| Quadrant | # 1 sec bins | Bins with >0 counts | Bins with >2000 counts | High rate bins dominated by noise | Noise dominated (total time) | Noise dominated (detector-on time) | Marked lightcurve |
|---|---|---|---|---|---|---|---|
| A | 22149 | 19143 | 1 | 1 | 0.00% | 0.01% |  |
| B | 22149 | 19144 | 3 | 3 | 0.01% | 0.02% |  |
| C | 22149 | 19143 | 55 | 55 | 0.25% | 0.29% |  |
| D | 22149 | 19144 | 144 | 144 | 0.65% | 0.75% |  |
Top three noisy pixels from each quadrant. If the there are fewer than three noisy pixels in the level2.evt file, extra rows are filled as -1
| Pixel properties | Quadrant properties | ||||||
|---|---|---|---|---|---|---|---|
| Quadrant | DetID | PixID | Counts | Sigma | Mean | Median | Sigma |
| A | 15 | 174 | 14216 | 61.5 | 989 | 971 | 215.4 |
| A | 4 | 2 | 11509 | 48.93 | 989 | 971 | 215.4 |
| A | 12 | 194 | 6454 | 25.46 | 989 | 971 | 215.4 |
| B | 0 | 219 | 128063 | 667.97 | 1005 | 982 | 190.2 |
| B | 10 | 245 | 124043 | 646.84 | 1005 | 982 | 190.2 |
| B | 7 | 220 | 109814 | 572.05 | 1005 | 982 | 190.2 |
| C | 4 | 254 | 1101177 | 4923.82 | 946 | 940 | 223.5 |
| C | 5 | 218 | 154607 | 687.7 | 946 | 940 | 223.5 |
| C | 3 | 233 | 39905 | 174.38 | 946 | 940 | 223.5 |
| D | 7 | 238 | 998466 | 4388.05 | 962 | 934 | 227.3 |
| D | 10 | 70 | 149637 | 654.13 | 962 | 934 | 227.3 |
| D | 2 | 152 | 95792 | 417.27 | 962 | 934 | 227.3 |
Histogram calculated using DETX and DETY for each event in the final _common_clean file
| Quadrant A |  |
 |
Quadrant B |
|---|---|---|---|
| Quadrant D |  |
 |
Quadrant C |
| Plot type | Count rate plots | Images |
|---|---|---|
| Comparison with Poisson distribution Blue bars denote a histogram of data divided into 1 sec bins. Red curve is a Poisson curve with rate = median count rate of data. |
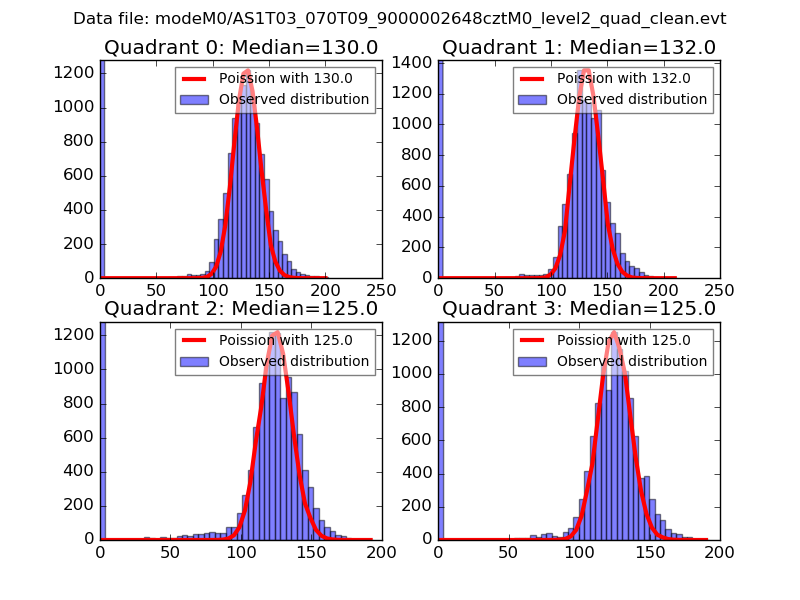 |
 |
| Quadrant-wise count rates Data is divided into 100 sec bins |
 |
|
| Module-wise count rates for Quadrant A Data is divided into 100 sec bins |
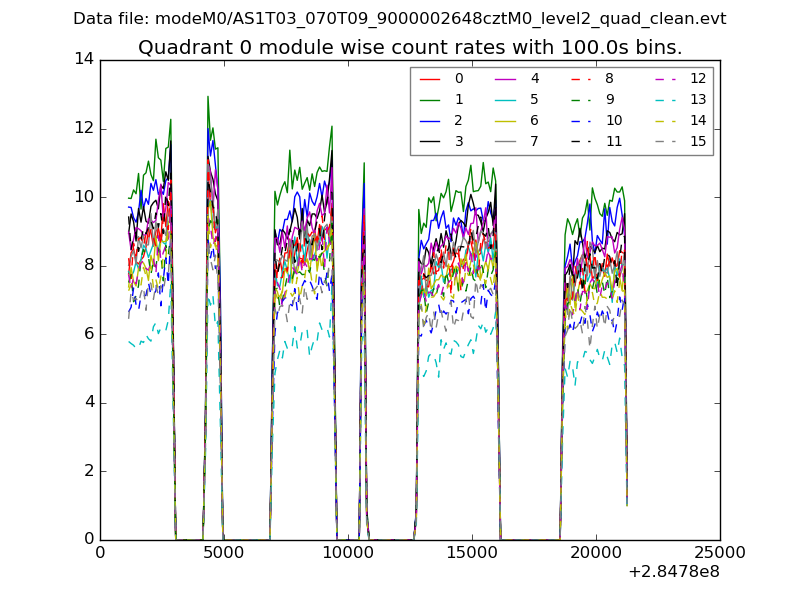 |
 |
| Module-wise count rates for Quadrant B Data is divided into 100 sec bins |
 |
 |
| Module-wise count rates for Quadrant C Data is divided into 100 sec bins |
 |
 |
| Module-wise count rates for Quadrant D Data is divided into 100 sec bins |
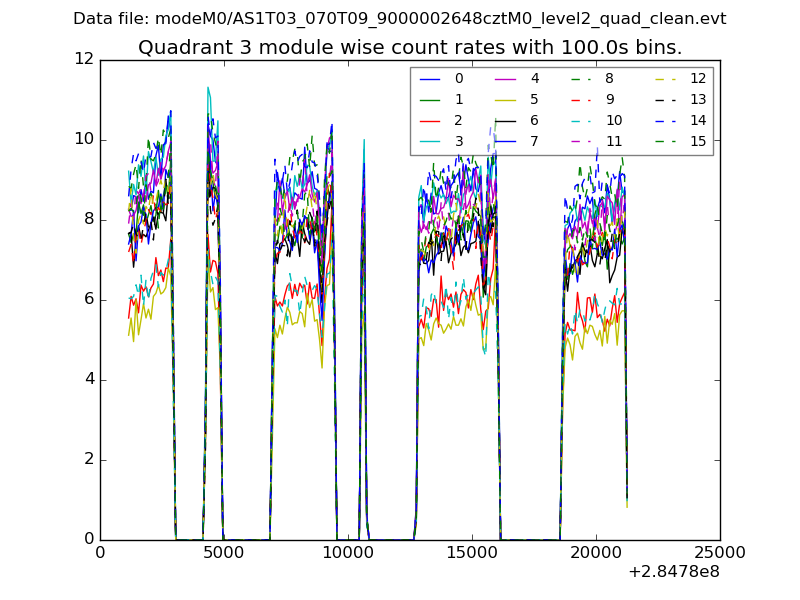 |
 |
| Parameter | Plot |
|---|---|
| CZT HV Monitor |  |
| D_VDD |  |
| Temperature 1 |  |
| Veto HV Monitor |  |
| Veto LLD |  |
| Alpha Counter |  |
| _CPM_Rate |  |
| CZT Counter |  |
| +2.5 Volts monitor |  |
| +5 Volts monitor |  |
| _ROLL_ROT |  |
| _Roll_DEC |  |
| _Roll_RA | 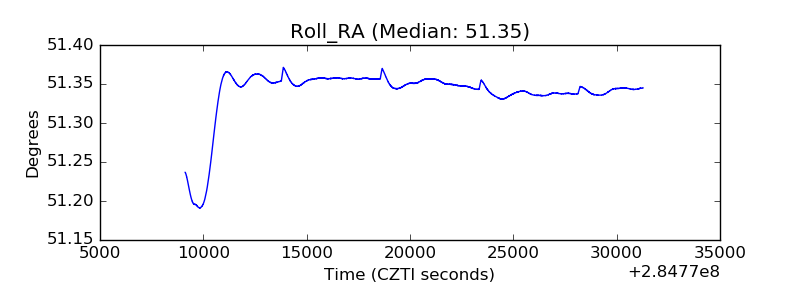 |
| Veto Counter |  |