| Param | Original file | Final file |
|---|---|---|
| Filename | modeM0/AS1A05_015T01_9000002650cztM0_level2.evt | modeM0/AS1A05_015T01_9000002650cztM0_level2_quad_clean.evt |
| Size (bytes) | 24,122,180,160 | 4,468,487,040 |
| Size | 22.5 GB | 4.2 GB |
| Events in quadrant A | 158,440,849 | 28,522,730 |
| Events in quadrant B | 167,627,811 | 29,095,992 |
| Events in quadrant C | 173,763,617 | 27,777,523 |
| Events in quadrant D | 208,149,321 | 27,035,700 |
| Mode SS | |||
|---|---|---|---|
| Quadrant | BADHDUFLAG | Total packets | Discarded packets |
| A | 0 | 6812 | 0 |
| B | 0 | 6812 | 0 |
| C | 0 | 6812 | 0 |
| D | 0 | 6684 | 0 |
| Mode M9 | |||
|---|---|---|---|
| Quadrant | BADHDUFLAG | Total packets | Discarded packets |
| A | 0 | 510 | 0 |
| B | 0 | 510 | 0 |
| C | 0 | 510 | 0 |
| D | 0 | 510 | 0 |
| Mode M0 | |||
|---|---|---|---|
| Quadrant | BADHDUFLAG | Total packets | Discarded packets |
| A | 0 | 697137 | 0 |
| B | 0 | 717523 | 0 |
| C | 0 | 733144 | 0 |
| D | 0 | 851811 | 0 |
| Quadrant | Total seconds | Saturated seconds | Saturation percentage |
|---|---|---|---|
| A | 334735 | 4947 | 1.477885% |
| B | 334737 | 6271 | 1.873411% |
| C | 334737 | 9859 | 2.945297% |
| D | 334737 | 16322 | 4.876067% |
Noise dominated data is calculated using 1-second bins in cleaned event files. If a bin has >2000 counts, and if more than 50% of those come from <1% of pixels, then it is considered to be noise-dominated and hence unusable.
| Quadrant | # 1 sec bins | Bins with >0 counts | Bins with >2000 counts | High rate bins dominated by noise | Noise dominated (total time) | Noise dominated (detector-on time) | Marked lightcurve |
|---|---|---|---|---|---|---|---|
| A | 385887 | 334792 | 399 | 399 | 0.10% | 0.12% | 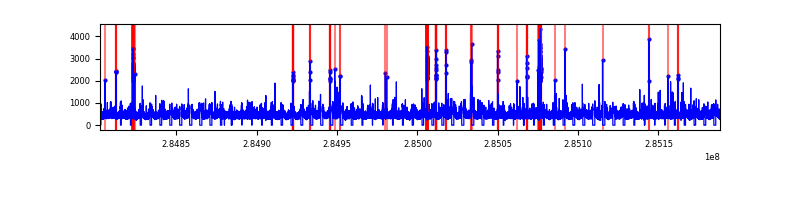 |
| B | 385887 | 334792 | 896 | 896 | 0.23% | 0.27% |  |
| C | 385887 | 334790 | 2651 | 2651 | 0.69% | 0.79% |  |
| D | 385887 | 334791 | 10765 | 10765 | 2.79% | 3.22% |  |
Top three noisy pixels from each quadrant. If the there are fewer than three noisy pixels in the level2.evt file, extra rows are filled as -1
| Pixel properties | Quadrant properties | ||||||
|---|---|---|---|---|---|---|---|
| Quadrant | DetID | PixID | Counts | Sigma | Mean | Median | Sigma |
| A | 15 | 174 | 2624568 | 318.12 | 40548 | 39679 | 8125.6 |
| A | 0 | 226 | 353167 | 38.58 | 40548 | 39679 | 8125.6 |
| A | 3 | 137 | 301137 | 32.18 | 40548 | 39679 | 8125.6 |
| B | 7 | 220 | 2054004 | 264.56 | 40596 | 39522 | 7614.4 |
| B | 10 | 245 | 1841389 | 236.64 | 40596 | 39522 | 7614.4 |
| B | 12 | 111 | 915047 | 114.98 | 40596 | 39522 | 7614.4 |
| C | 4 | 254 | 12485836 | 1384.65 | 38790 | 39069 | 8989.1 |
| C | 14 | 238 | 6004048 | 663.58 | 38790 | 39069 | 8989.1 |
| C | 3 | 233 | 1808952 | 196.89 | 38790 | 39069 | 8989.1 |
| D | 7 | 238 | 48241796 | 5193.02 | 38703 | 37785 | 9282.5 |
| D | 10 | 70 | 3861986 | 411.98 | 38703 | 37785 | 9282.5 |
| D | 1 | 52 | 2815041 | 299.19 | 38703 | 37785 | 9282.5 |
Histogram calculated using DETX and DETY for each event in the final _common_clean file
| Quadrant A |  |
 |
Quadrant B |
|---|---|---|---|
| Quadrant D |  |
 |
Quadrant C |
| Plot type | Count rate plots | Images |
|---|---|---|
| Comparison with Poisson distribution Blue bars denote a histogram of data divided into 1 sec bins. Red curve is a Poisson curve with rate = median count rate of data. |
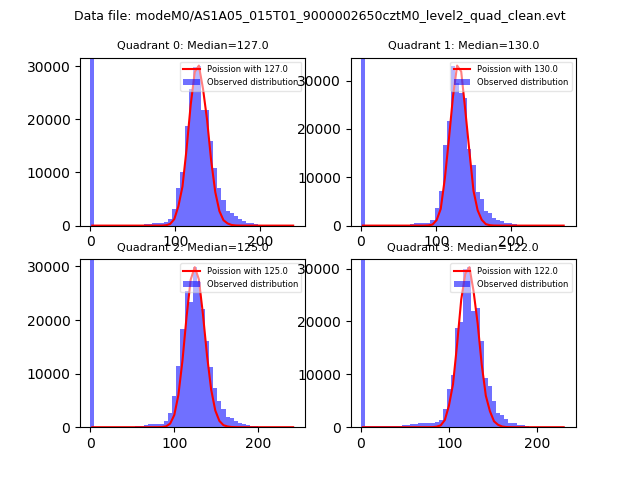 |
 |
| Quadrant-wise count rates Data is divided into 100 sec bins |
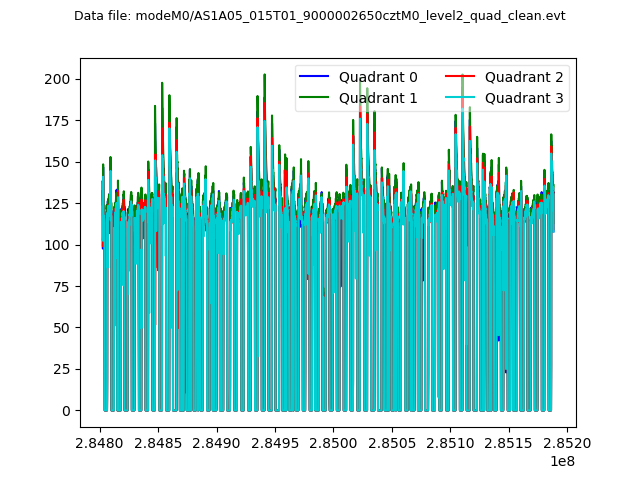 |
|
| Module-wise count rates for Quadrant A Data is divided into 100 sec bins |
 |
 |
| Module-wise count rates for Quadrant B Data is divided into 100 sec bins |
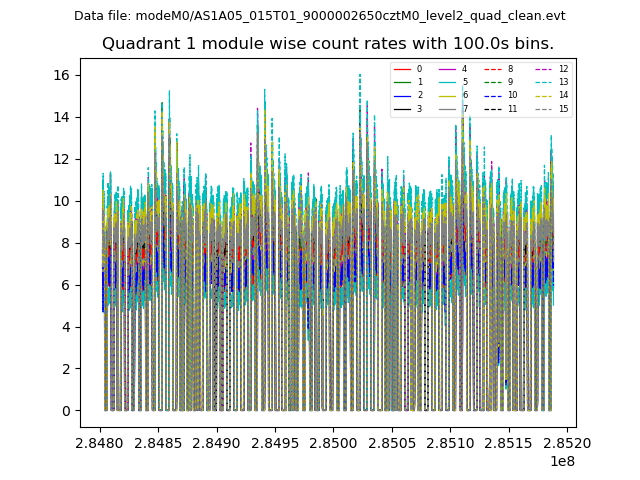 |
 |
| Module-wise count rates for Quadrant C Data is divided into 100 sec bins |
 |
 |
| Module-wise count rates for Quadrant D Data is divided into 100 sec bins |
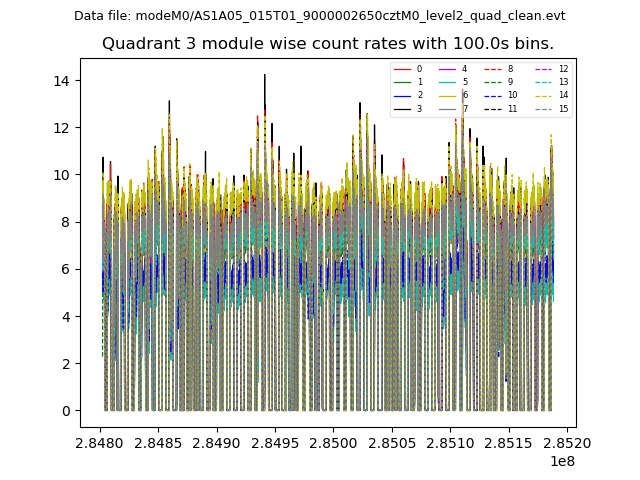 |
 |
| Parameter | Plot |
|---|---|
| CZT HV Monitor | 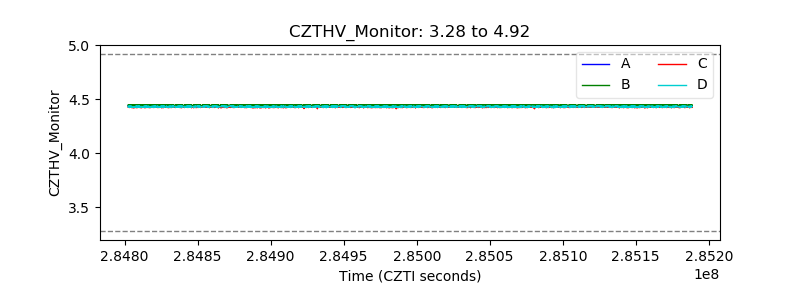 |
| D_VDD |  |
| Temperature 1 |  |
| Veto HV Monitor |  |
| Veto LLD |  |
| Alpha Counter |  |
| _CPM_Rate | 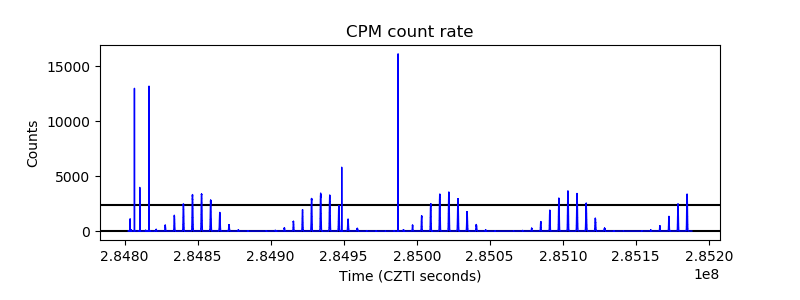 |
| CZT Counter |  |
| +2.5 Volts monitor |  |
| +5 Volts monitor |  |
| _ROLL_ROT |  |
| _Roll_DEC | 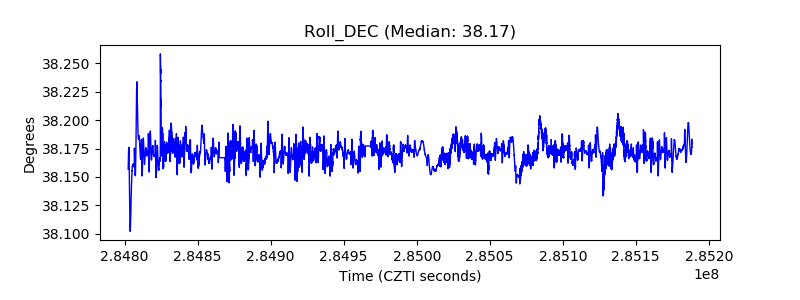 |
| _Roll_RA |  |
| Veto Counter |  |