| Param | Original file | Final file |
|---|---|---|
| Filename | modeM0/AS1T03_070T08_9000002646cztM0_level2_bc.evt | modeM0/AS1T03_070T08_9000002646cztM0_level2_quad_clean.evt |
| Size (bytes) | 668,076,480 | 242,464,320 |
| Size | 637.1 MB | 231.2 MB |
| Events in quadrant A | 4,222,176 | 1,531,434 |
| Events in quadrant B | 4,522,464 | 1,575,174 |
| Events in quadrant C | 4,991,465 | 1,479,070 |
| Events in quadrant D | 5,200,488 | 1,453,904 |
| Mode M0 | |||
|---|---|---|---|
| Quadrant | BADHDUFLAG | Total packets | Discarded packets |
| A | 0 | 39984 | 0 |
| B | 0 | 40995 | 0 |
| C | 0 | 43377 | 0 |
| D | 0 | 43201 | 0 |
| Mode SS | |||
|---|---|---|---|
| Quadrant | BADHDUFLAG | Total packets | Discarded packets |
| A | 0 | 388 | 0 |
| B | 0 | 388 | 0 |
| C | 0 | 388 | 0 |
| D | 0 | 388 | 0 |
| Mode M9 | |||
|---|---|---|---|
| Quadrant | BADHDUFLAG | Total packets | Discarded packets |
| A | 0 | 50 | 0 |
| B | 0 | 50 | 0 |
| C | 0 | 50 | 0 |
| D | 0 | 50 | 0 |
| Quadrant | Total seconds | Saturated seconds | Saturation percentage |
|---|---|---|---|
| A | 18922 | 229 | 1.210231% |
| B | 18922 | 234 | 1.236656% |
| C | 18922 | 546 | 2.885530% |
| D | 18922 | 332 | 1.754571% |
Noise dominated data is calculated using 1-second bins in cleaned event files. If a bin has >2000 counts, and if more than 50% of those come from <1% of pixels, then it is considered to be noise-dominated and hence unusable.
| Quadrant | # 1 sec bins | Bins with >0 counts | Bins with >2000 counts | High rate bins dominated by noise | Noise dominated (total time) | Noise dominated (detector-on time) | Marked lightcurve |
|---|---|---|---|---|---|---|---|
| A | 24007 | 18922 | 36 | 36 | 0.15% | 0.19% |  |
| B | 24007 | 18922 | 18 | 18 | 0.07% | 0.10% |  |
| C | 24007 | 18921 | 8 | 8 | 0.03% | 0.04% |  |
| D | 24007 | 18921 | 37 | 37 | 0.15% | 0.20% |  |
Top three noisy pixels from each quadrant. If the there are fewer than three noisy pixels in the level2.evt file, extra rows are filled as -1
| Pixel properties | Quadrant properties | ||||||
|---|---|---|---|---|---|---|---|
| Quadrant | DetID | PixID | Counts | Sigma | Mean | Median | Sigma |
| A | 15 | 174 | 213827 | 957.88 | 1038 | 1021 | 222.2 |
| A | 4 | 2 | 13391 | 55.68 | 1038 | 1021 | 222.2 |
| A | 15 | 191 | 7678 | 29.96 | 1038 | 1021 | 222.2 |
| B | 4 | 142 | 136858 | 689.53 | 1061 | 1038 | 197.0 |
| B | 0 | 219 | 79198 | 396.8 | 1061 | 1038 | 197.0 |
| B | 10 | 245 | 77577 | 388.57 | 1061 | 1038 | 197.0 |
| C | 4 | 254 | 731076 | 3062.2 | 1007 | 1004 | 238.4 |
| C | 3 | 233 | 184999 | 771.74 | 1007 | 1004 | 238.4 |
| C | 5 | 218 | 111532 | 463.6 | 1007 | 1004 | 238.4 |
| D | 7 | 238 | 839151 | 3360.72 | 1012 | 985 | 249.4 |
| D | 5 | 222 | 195923 | 781.62 | 1012 | 985 | 249.4 |
| D | 1 | 52 | 85569 | 339.15 | 1012 | 985 | 249.4 |
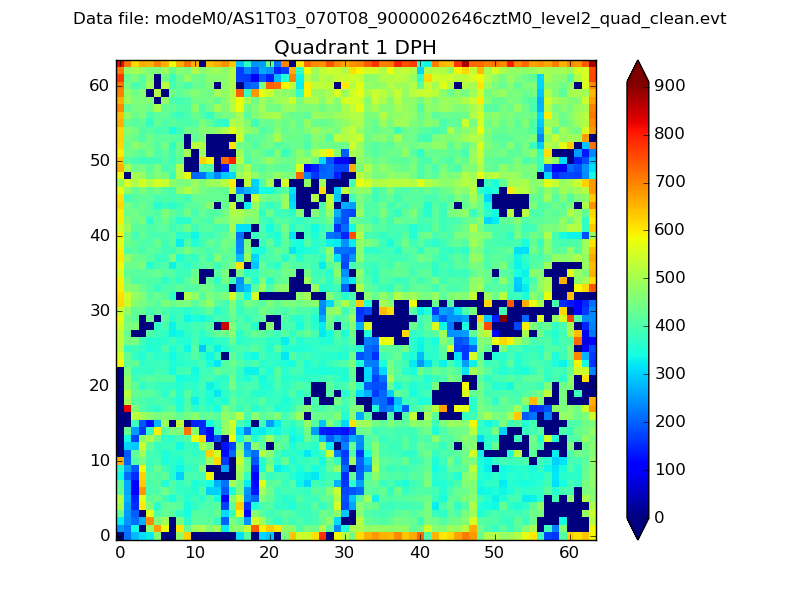
Histogram calculated using DETX and DETY for each event in the final _common_clean file
| Quadrant A |  |
 |
Quadrant B |
|---|---|---|---|
| Quadrant D |  |
 |
Quadrant C |
| Plot type | Count rate plots | Images |
|---|---|---|
| Comparison with Poisson distribution Blue bars denote a histogram of data divided into 1 sec bins. Red curve is a Poisson curve with rate = median count rate of data. |
 |
 |
| Quadrant-wise count rates Data is divided into 100 sec bins |
 |
|
| Module-wise count rates for Quadrant A Data is divided into 100 sec bins |
 |
 |
| Module-wise count rates for Quadrant B Data is divided into 100 sec bins |
 |
 |
| Module-wise count rates for Quadrant C Data is divided into 100 sec bins |
 |
 |
| Module-wise count rates for Quadrant D Data is divided into 100 sec bins |
 |
 |
| Parameter | Plot |
|---|---|
| CZT HV Monitor |  |
| D_VDD |  |
| Temperature 1 |  |
| Veto HV Monitor |  |
| Veto LLD |  |
| Alpha Counter |  |
| _CPM_Rate |  |
| CZT Counter |  |
| +2.5 Volts monitor |  |
| +5 Volts monitor |  |
| _ROLL_ROT |  |
| _Roll_DEC |  |
| _Roll_RA |  |
| Veto Counter |  |