| Param | Original file | Final file |
|---|---|---|
| Filename | modeM0/AS1T03_070T07_9000002644cztM0_level2_bc.evt | modeM0/AS1T03_070T07_9000002644cztM0_level2_quad_clean.evt |
| Size (bytes) | 595,290,240 | 173,805,120 |
| Size | 567.7 MB | 165.8 MB |
| Events in quadrant A | 3,146,961 | 1,144,757 |
| Events in quadrant B | 4,375,259 | 1,126,622 |
| Events in quadrant C | 4,902,040 | 874,492 |
| Events in quadrant D | 4,591,216 | 1,099,182 |
| Mode M0 | |||
|---|---|---|---|
| Quadrant | BADHDUFLAG | Total packets | Discarded packets |
| A | 0 | 31280 | 0 |
| B | 0 | 34873 | 0 |
| C | 0 | 48036 | 0 |
| D | 0 | 35706 | 0 |
| Mode M9 | |||
|---|---|---|---|
| Quadrant | BADHDUFLAG | Total packets | Discarded packets |
| A | 0 | 24 | 0 |
| B | 0 | 24 | 0 |
| C | 0 | 24 | 0 |
| D | 0 | 24 | 0 |
| Mode SS | |||
|---|---|---|---|
| Quadrant | BADHDUFLAG | Total packets | Discarded packets |
| A | 0 | 302 | 0 |
| B | 0 | 302 | 0 |
| C | 0 | 302 | 0 |
| D | 0 | 302 | 0 |
| Quadrant | Total seconds | Saturated seconds | Saturation percentage |
|---|---|---|---|
| A | 14735 | 207 | 1.404818% |
| B | 14735 | 516 | 3.501866% |
| C | 14735 | 3232 | 21.934170% |
| D | 14735 | 454 | 3.081099% |
Noise dominated data is calculated using 1-second bins in cleaned event files. If a bin has >2000 counts, and if more than 50% of those come from <1% of pixels, then it is considered to be noise-dominated and hence unusable.
| Quadrant | # 1 sec bins | Bins with >0 counts | Bins with >2000 counts | High rate bins dominated by noise | Noise dominated (total time) | Noise dominated (detector-on time) | Marked lightcurve |
|---|---|---|---|---|---|---|---|
| A | 17220 | 14733 | 3 | 3 | 0.02% | 0.02% |  |
| B | 17220 | 14733 | 153 | 153 | 0.89% | 1.04% |  |
| C | 17220 | 14730 | 16 | 16 | 0.09% | 0.11% |  |
| D | 17220 | 14735 | 116 | 116 | 0.67% | 0.79% |  |
Top three noisy pixels from each quadrant. If the there are fewer than three noisy pixels in the level2.evt file, extra rows are filled as -1
| Pixel properties | Quadrant properties | ||||||
|---|---|---|---|---|---|---|---|
| Quadrant | DetID | PixID | Counts | Sigma | Mean | Median | Sigma |
| A | 15 | 174 | 315473 | 1913.13 | 736 | 721 | 164.5 |
| A | 12 | 194 | 4852 | 25.11 | 736 | 721 | 164.5 |
| A | 0 | 226 | 4832 | 24.99 | 736 | 721 | 164.5 |
| B | 10 | 245 | 1303753 | 9091.21 | 733 | 712 | 143.3 |
| B | 7 | 220 | 76748 | 530.49 | 733 | 712 | 143.3 |
| B | 0 | 219 | 69937 | 482.97 | 733 | 712 | 143.3 |
| C | 4 | 254 | 2271817 | 15568.87 | 606 | 599 | 145.9 |
| C | 3 | 233 | 165287 | 1128.91 | 606 | 599 | 145.9 |
| C | 5 | 218 | 71329 | 484.84 | 606 | 599 | 145.9 |
| D | 7 | 238 | 832122 | 4897.84 | 720 | 697 | 169.8 |
| D | 5 | 222 | 619224 | 3643.68 | 720 | 697 | 169.8 |
| D | 2 | 165 | 123717 | 724.7 | 720 | 697 | 169.8 |
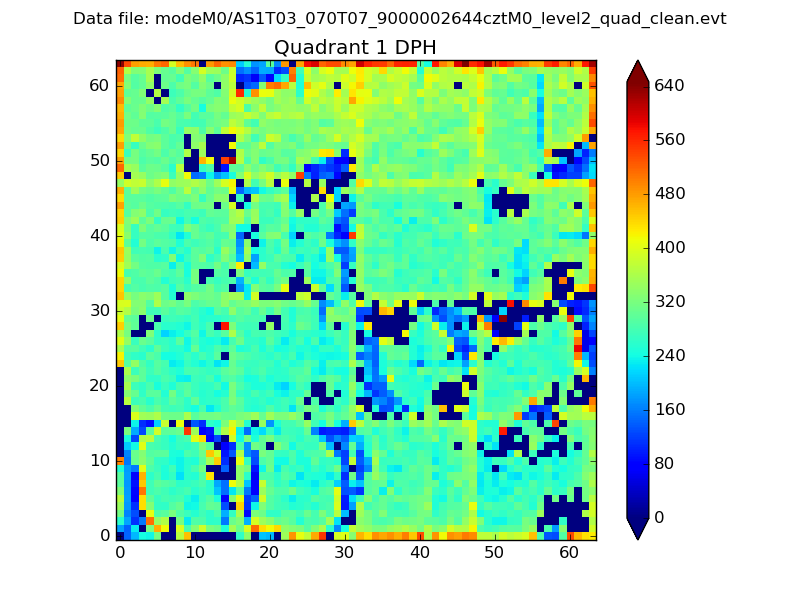
Histogram calculated using DETX and DETY for each event in the final _common_clean file
| Quadrant A |  |
 |
Quadrant B |
|---|---|---|---|
| Quadrant D |  |
 |
Quadrant C |
| Plot type | Count rate plots | Images |
|---|---|---|
| Comparison with Poisson distribution Blue bars denote a histogram of data divided into 1 sec bins. Red curve is a Poisson curve with rate = median count rate of data. |
 |
 |
| Quadrant-wise count rates Data is divided into 100 sec bins |
 |
|
| Module-wise count rates for Quadrant A Data is divided into 100 sec bins |
 |
 |
| Module-wise count rates for Quadrant B Data is divided into 100 sec bins |
 |
 |
| Module-wise count rates for Quadrant C Data is divided into 100 sec bins |
 |
 |
| Module-wise count rates for Quadrant D Data is divided into 100 sec bins |
 |
 |
| Parameter | Plot |
|---|---|
| CZT HV Monitor |  |
| D_VDD |  |
| Temperature 1 | 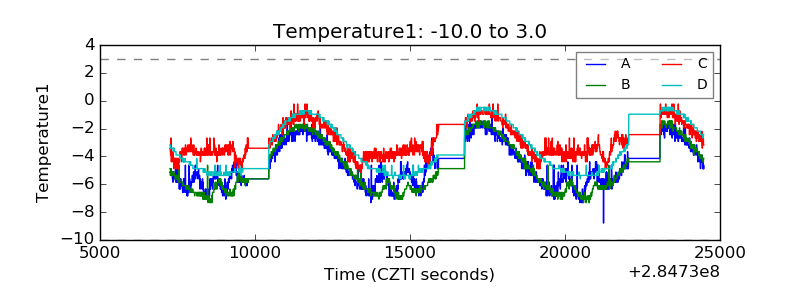 |
| Veto HV Monitor |  |
| Veto LLD | 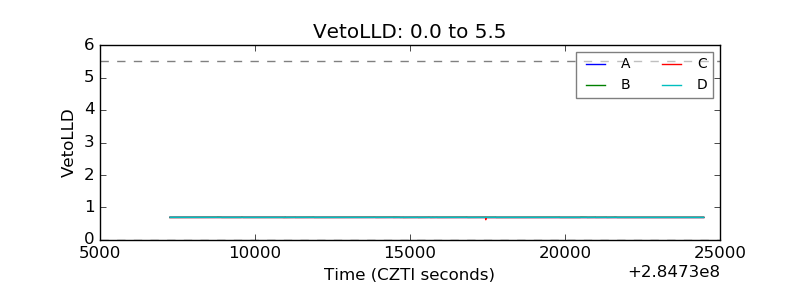 |
| Alpha Counter | 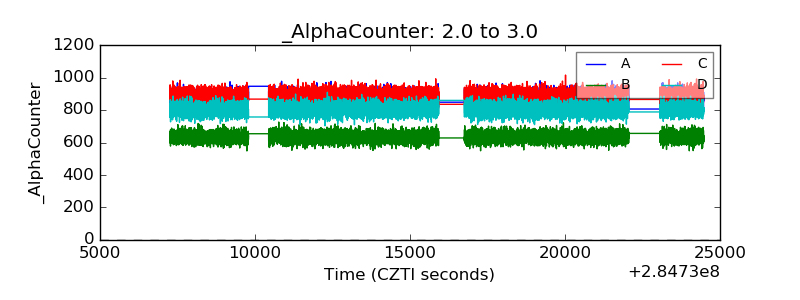 |
| _CPM_Rate |  |
| CZT Counter |  |
| +2.5 Volts monitor | 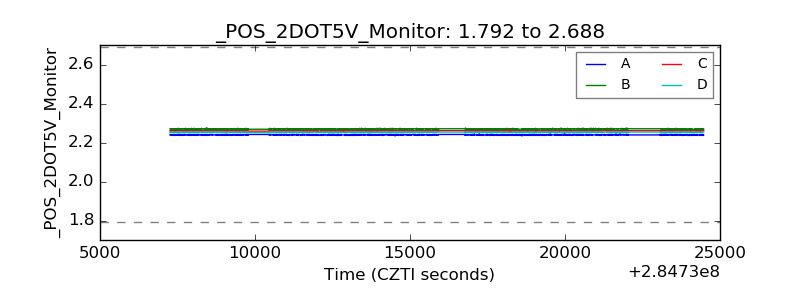 |
| +5 Volts monitor |  |
| _ROLL_ROT |  |
| _Roll_DEC |  |
| _Roll_RA |  |
| Veto Counter |  |