| Param | Original file | Final file |
|---|---|---|
| Filename | modeM0/AS1T03_070T06_9000002642cztM0_level2_bc.evt | modeM0/AS1T03_070T06_9000002642cztM0_level2_quad_clean.evt |
| Size (bytes) | 503,208,000 | 204,079,680 |
| Size | 479.9 MB | 194.6 MB |
| Events in quadrant A | 3,095,393 | 1,288,206 |
| Events in quadrant B | 3,518,466 | 1,292,802 |
| Events in quadrant C | 3,748,330 | 1,235,643 |
| Events in quadrant D | 3,765,570 | 1,247,700 |
| Mode M0 | |||
|---|---|---|---|
| Quadrant | BADHDUFLAG | Total packets | Discarded packets |
| A | 0 | 33380 | 0 |
| B | 0 | 34733 | 0 |
| C | 0 | 35571 | 0 |
| D | 0 | 35009 | 0 |
| Mode M9 | |||
|---|---|---|---|
| Quadrant | BADHDUFLAG | Total packets | Discarded packets |
| A | 0 | 8 | 0 |
| B | 0 | 8 | 0 |
| C | 0 | 8 | 0 |
| D | 0 | 8 | 0 |
| Mode SS | |||
|---|---|---|---|
| Quadrant | BADHDUFLAG | Total packets | Discarded packets |
| A | 0 | 328 | 0 |
| B | 0 | 328 | 0 |
| C | 0 | 328 | 0 |
| D | 0 | 328 | 0 |
| Quadrant | Total seconds | Saturated seconds | Saturation percentage |
|---|---|---|---|
| A | 16199 | 461 | 2.845855% |
| B | 16199 | 549 | 3.389098% |
| C | 16199 | 633 | 3.907649% |
| D | 16199 | 405 | 2.500154% |
Noise dominated data is calculated using 1-second bins in cleaned event files. If a bin has >2000 counts, and if more than 50% of those come from <1% of pixels, then it is considered to be noise-dominated and hence unusable.
| Quadrant | # 1 sec bins | Bins with >0 counts | Bins with >2000 counts | High rate bins dominated by noise | Noise dominated (total time) | Noise dominated (detector-on time) | Marked lightcurve |
|---|---|---|---|---|---|---|---|
| A | 16919 | 16198 | 0 | 0 | 0.00% | 0.00% |  |
| B | 16919 | 16199 | 1 | 1 | 0.01% | 0.01% |  |
| C | 16919 | 16197 | 7 | 7 | 0.04% | 0.04% | 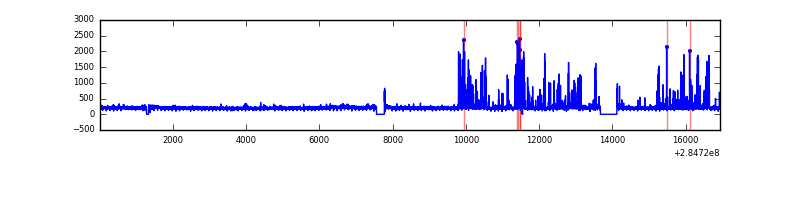 |
| D | 16919 | 16199 | 7 | 7 | 0.04% | 0.04% |  |
Top three noisy pixels from each quadrant. If the there are fewer than three noisy pixels in the level2.evt file, extra rows are filled as -1
| Pixel properties | Quadrant properties | ||||||
|---|---|---|---|---|---|---|---|
| Quadrant | DetID | PixID | Counts | Sigma | Mean | Median | Sigma |
| A | 15 | 174 | 45321 | 250.9 | 792 | 772 | 177.6 |
| A | 0 | 226 | 5253 | 25.24 | 792 | 772 | 177.6 |
| A | 12 | 194 | 5228 | 25.1 | 792 | 772 | 177.6 |
| B | 7 | 220 | 222185 | 1419.58 | 799 | 776 | 156.0 |
| B | 0 | 219 | 62724 | 397.18 | 799 | 776 | 156.0 |
| B | 0 | 229 | 38545 | 242.16 | 799 | 776 | 156.0 |
| C | 4 | 254 | 545503 | 2964.75 | 768 | 761 | 183.7 |
| C | 5 | 218 | 122927 | 664.89 | 768 | 761 | 183.7 |
| C | 3 | 233 | 58480 | 314.13 | 768 | 761 | 183.7 |
| D | 5 | 222 | 327310 | 1763.02 | 783 | 758 | 185.2 |
| D | 2 | 165 | 96782 | 518.42 | 783 | 758 | 185.2 |
| D | 10 | 70 | 85463 | 457.31 | 783 | 758 | 185.2 |
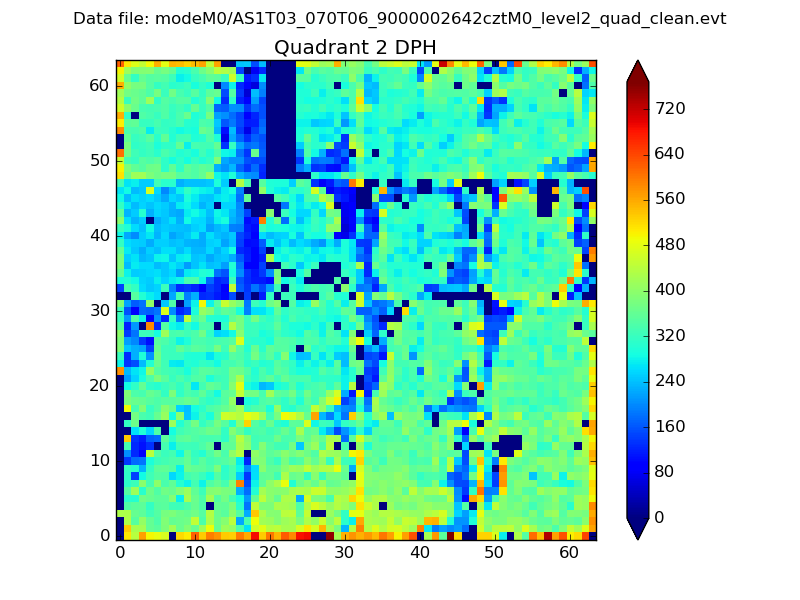
Histogram calculated using DETX and DETY for each event in the final _common_clean file
| Quadrant A |  |
 |
Quadrant B |
|---|---|---|---|
| Quadrant D |  |
 |
Quadrant C |
| Plot type | Count rate plots | Images |
|---|---|---|
| Comparison with Poisson distribution Blue bars denote a histogram of data divided into 1 sec bins. Red curve is a Poisson curve with rate = median count rate of data. |
 |
 |
| Quadrant-wise count rates Data is divided into 100 sec bins |
 |
|
| Module-wise count rates for Quadrant A Data is divided into 100 sec bins |
 |
 |
| Module-wise count rates for Quadrant B Data is divided into 100 sec bins |
 |
 |
| Module-wise count rates for Quadrant C Data is divided into 100 sec bins |
 |
 |
| Module-wise count rates for Quadrant D Data is divided into 100 sec bins |
 |
 |
| Parameter | Plot |
|---|---|
| CZT HV Monitor |  |
| D_VDD |  |
| Temperature 1 |  |
| Veto HV Monitor |  |
| Veto LLD |  |
| Alpha Counter |  |
| _CPM_Rate |  |
| CZT Counter |  |
| +2.5 Volts monitor |  |
| +5 Volts monitor |  |
| _ROLL_ROT |  |
| _Roll_DEC |  |
| _Roll_RA |  |
| Veto Counter |  |