| Param | Original file | Final file |
|---|---|---|
| Filename | modeM0/AS1T03_070T05_9000002640cztM0_level2_bc.evt | modeM0/AS1T03_070T05_9000002640cztM0_level2_quad_clean.evt |
| Size (bytes) | 762,255,360 | 301,893,120 |
| Size | 726.9 MB | 287.9 MB |
| Events in quadrant A | 4,839,772 | 1,908,272 |
| Events in quadrant B | 6,034,709 | 1,912,625 |
| Events in quadrant C | 4,924,491 | 1,849,839 |
| Events in quadrant D | 5,641,266 | 1,819,389 |
| Mode SS | |||
|---|---|---|---|
| Quadrant | BADHDUFLAG | Total packets | Discarded packets |
| A | 0 | 490 | 0 |
| B | 0 | 490 | 0 |
| C | 0 | 490 | 0 |
| D | 0 | 490 | 0 |
| Mode M0 | |||
|---|---|---|---|
| Quadrant | BADHDUFLAG | Total packets | Discarded packets |
| A | 0 | 49220 | 0 |
| B | 0 | 53256 | 0 |
| C | 0 | 49485 | 0 |
| D | 0 | 52237 | 0 |
| Mode M9 | |||
|---|---|---|---|
| Quadrant | BADHDUFLAG | Total packets | Discarded packets |
| A | 0 | 38 | 0 |
| B | 0 | 38 | 0 |
| C | 0 | 38 | 0 |
| D | 0 | 38 | 0 |
| Quadrant | Total seconds | Saturated seconds | Saturation percentage |
|---|---|---|---|
| A | 24028 | 249 | 1.036291% |
| B | 24028 | 589 | 2.451307% |
| C | 24028 | 300 | 1.248543% |
| D | 24028 | 372 | 1.548194% |
Noise dominated data is calculated using 1-second bins in cleaned event files. If a bin has >2000 counts, and if more than 50% of those come from <1% of pixels, then it is considered to be noise-dominated and hence unusable.
| Quadrant | # 1 sec bins | Bins with >0 counts | Bins with >2000 counts | High rate bins dominated by noise | Noise dominated (total time) | Noise dominated (detector-on time) | Marked lightcurve |
|---|---|---|---|---|---|---|---|
| A | 27883 | 24029 | 0 | 0 | 0.00% | 0.00% | 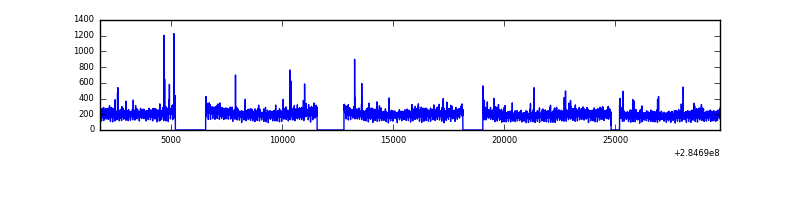 |
| B | 27883 | 24029 | 75 | 75 | 0.27% | 0.31% |  |
| C | 27883 | 24028 | 0 | 0 | 0.00% | 0.00% |  |
| D | 27883 | 24028 | 38 | 38 | 0.14% | 0.16% | 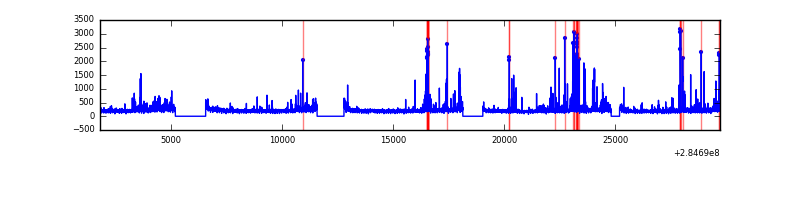 |
Top three noisy pixels from each quadrant. If the there are fewer than three noisy pixels in the level2.evt file, extra rows are filled as -1
| Pixel properties | Quadrant properties | ||||||
|---|---|---|---|---|---|---|---|
| Quadrant | DetID | PixID | Counts | Sigma | Mean | Median | Sigma |
| A | 15 | 191 | 28518 | 100.74 | 1245 | 1220 | 271.0 |
| A | 15 | 174 | 19344 | 66.89 | 1245 | 1220 | 271.0 |
| A | 4 | 2 | 15762 | 53.67 | 1245 | 1220 | 271.0 |
| B | 10 | 245 | 698047 | 2928.99 | 1258 | 1225 | 237.9 |
| B | 7 | 220 | 174068 | 726.52 | 1258 | 1225 | 237.9 |
| B | 0 | 189 | 98056 | 407.01 | 1258 | 1225 | 237.9 |
| C | 5 | 218 | 155196 | 536.97 | 1212 | 1206 | 286.8 |
| C | 5 | 219 | 42703 | 144.7 | 1212 | 1206 | 286.8 |
| C | 0 | 207 | 30816 | 103.25 | 1212 | 1206 | 286.8 |
| D | 5 | 222 | 261490 | 863.55 | 1217 | 1180 | 301.4 |
| D | 1 | 52 | 185335 | 610.92 | 1217 | 1180 | 301.4 |
| D | 7 | 38 | 131731 | 433.09 | 1217 | 1180 | 301.4 |
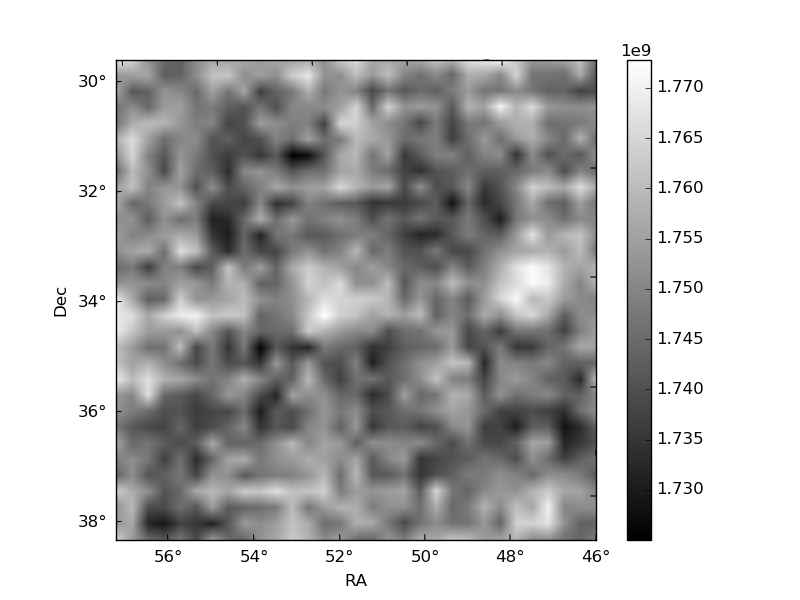
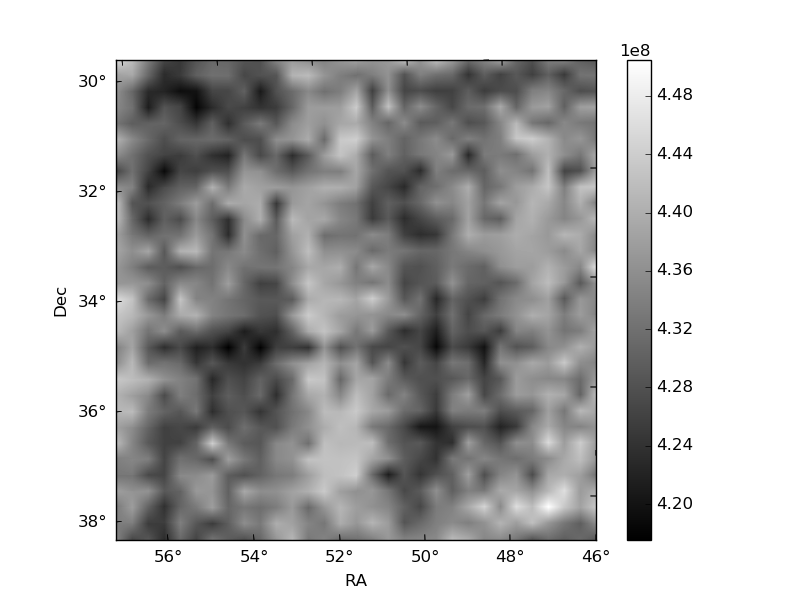
Histogram calculated using DETX and DETY for each event in the final _common_clean file
| Quadrant A |  |
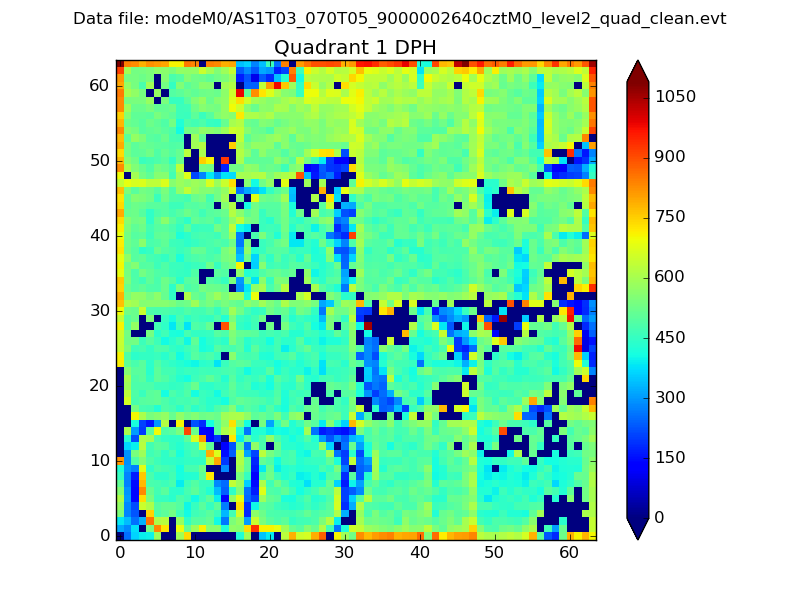 |
Quadrant B |
|---|---|---|---|
| Quadrant D | 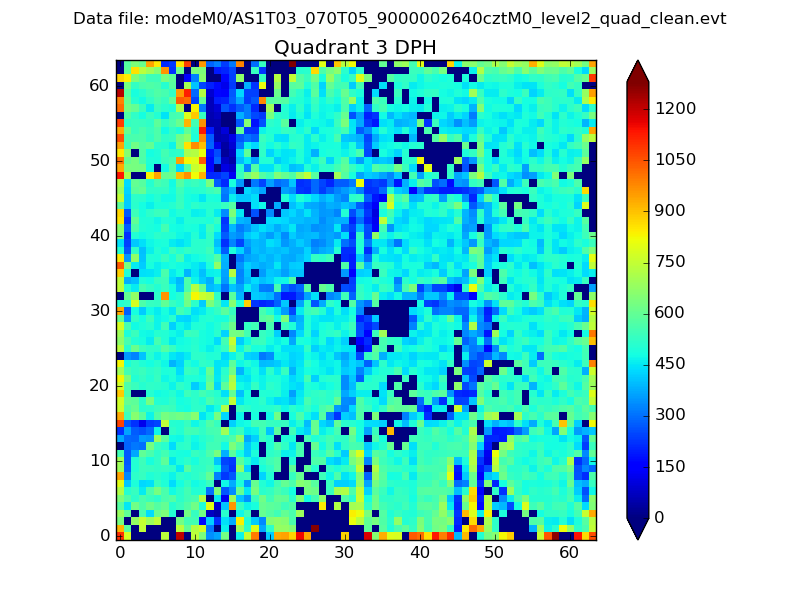 |
 |
Quadrant C |
| Plot type | Count rate plots | Images |
|---|---|---|
| Comparison with Poisson distribution Blue bars denote a histogram of data divided into 1 sec bins. Red curve is a Poisson curve with rate = median count rate of data. |
 |
 |
| Quadrant-wise count rates Data is divided into 100 sec bins |
 |
|
| Module-wise count rates for Quadrant A Data is divided into 100 sec bins |
 |
 |
| Module-wise count rates for Quadrant B Data is divided into 100 sec bins |
 |
 |
| Module-wise count rates for Quadrant C Data is divided into 100 sec bins |
 |
 |
| Module-wise count rates for Quadrant D Data is divided into 100 sec bins |
 |
 |
| Parameter | Plot |
|---|---|
| CZT HV Monitor |  |
| D_VDD |  |
| Temperature 1 |  |
| Veto HV Monitor |  |
| Veto LLD |  |
| Alpha Counter |  |
| _CPM_Rate |  |
| CZT Counter |  |
| +2.5 Volts monitor | 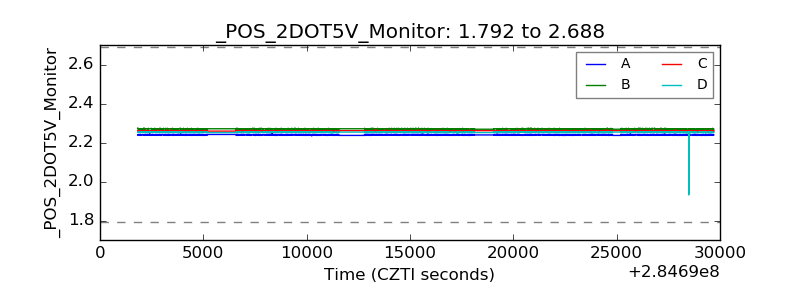 |
| +5 Volts monitor | 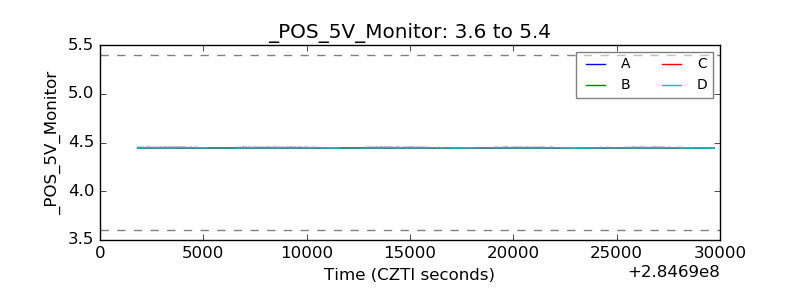 |
| _ROLL_ROT |  |
| _Roll_DEC |  |
| _Roll_RA | 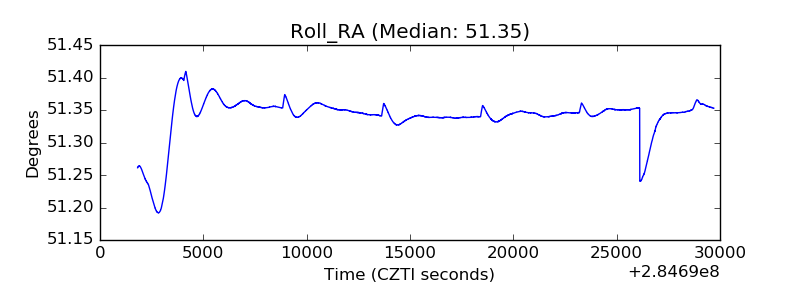 |
| Veto Counter |  |