| Param | Original file | Final file |
|---|---|---|
| Filename | modeM0/AS1T03_070T04_9000002638cztM0_level2_bc.evt | modeM0/AS1T03_070T04_9000002638cztM0_level2_quad_clean.evt |
| Size (bytes) | 561,542,400 | 182,802,240 |
| Size | 535.5 MB | 174.3 MB |
| Events in quadrant A | 4,597,695 | 1,154,900 |
| Events in quadrant B | 3,750,460 | 1,178,823 |
| Events in quadrant C | 3,303,912 | 1,126,256 |
| Events in quadrant D | 4,376,236 | 1,091,481 |
| Mode SS | |||
|---|---|---|---|
| Quadrant | BADHDUFLAG | Total packets | Discarded packets |
| A | 0 | 290 | 0 |
| B | 0 | 290 | 0 |
| C | 0 | 290 | 0 |
| D | 0 | 290 | 0 |
| Mode M9 | |||
|---|---|---|---|
| Quadrant | BADHDUFLAG | Total packets | Discarded packets |
| A | 0 | 40 | 0 |
| B | 0 | 40 | 0 |
| C | 0 | 40 | 0 |
| D | 0 | 40 | 0 |
| Mode M0 | |||
|---|---|---|---|
| Quadrant | BADHDUFLAG | Total packets | Discarded packets |
| A | 0 | 34819 | 0 |
| B | 0 | 31817 | 0 |
| C | 0 | 30214 | 0 |
| D | 0 | 34255 | 0 |
| Quadrant | Total seconds | Saturated seconds | Saturation percentage |
|---|---|---|---|
| A | 14272 | 502 | 3.517377% |
| B | 14272 | 209 | 1.464406% |
| C | 14272 | 129 | 0.903868% |
| D | 14272 | 167 | 1.170123% |
Noise dominated data is calculated using 1-second bins in cleaned event files. If a bin has >2000 counts, and if more than 50% of those come from <1% of pixels, then it is considered to be noise-dominated and hence unusable.
| Quadrant | # 1 sec bins | Bins with >0 counts | Bins with >2000 counts | High rate bins dominated by noise | Noise dominated (total time) | Noise dominated (detector-on time) | Marked lightcurve |
|---|---|---|---|---|---|---|---|
| A | 18187 | 14272 | 149 | 149 | 0.82% | 1.04% | 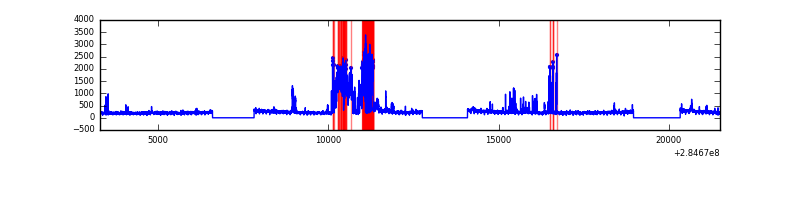 |
| B | 18187 | 14272 | 77 | 77 | 0.42% | 0.54% |  |
| C | 18187 | 14273 | 1 | 1 | 0.01% | 0.01% |  |
| D | 18187 | 14272 | 26 | 26 | 0.14% | 0.18% | 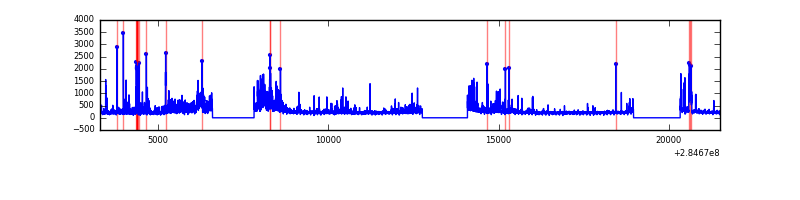 |
Top three noisy pixels from each quadrant. If the there are fewer than three noisy pixels in the level2.evt file, extra rows are filled as -1
| Pixel properties | Quadrant properties | ||||||
|---|---|---|---|---|---|---|---|
| Quadrant | DetID | PixID | Counts | Sigma | Mean | Median | Sigma |
| A | 15 | 174 | 1554286 | 9191.76 | 779 | 765 | 169.0 |
| A | 15 | 191 | 41309 | 239.89 | 779 | 765 | 169.0 |
| A | 4 | 2 | 7422 | 39.39 | 779 | 765 | 169.0 |
| B | 10 | 245 | 427011 | 2818.67 | 802 | 784 | 151.2 |
| B | 0 | 219 | 99948 | 655.78 | 802 | 784 | 151.2 |
| B | 0 | 230 | 40949 | 265.61 | 802 | 784 | 151.2 |
| C | 3 | 233 | 134446 | 736.58 | 770 | 768 | 181.5 |
| C | 5 | 218 | 130316 | 713.82 | 770 | 768 | 181.5 |
| C | 9 | 160 | 23911 | 127.52 | 770 | 768 | 181.5 |
| D | 1 | 52 | 837393 | 4249.63 | 766 | 746 | 196.9 |
| D | 7 | 238 | 242790 | 1229.43 | 766 | 746 | 196.9 |
| D | 13 | 168 | 106936 | 539.38 | 766 | 746 | 196.9 |
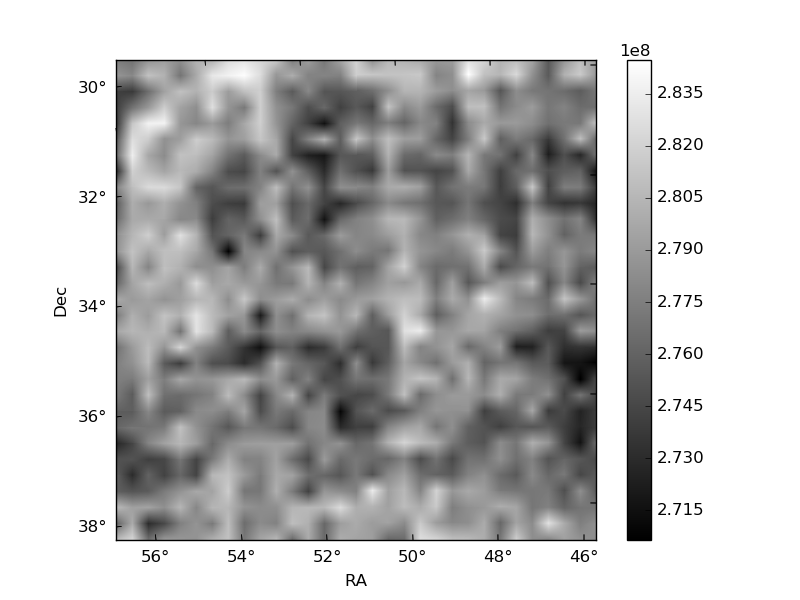
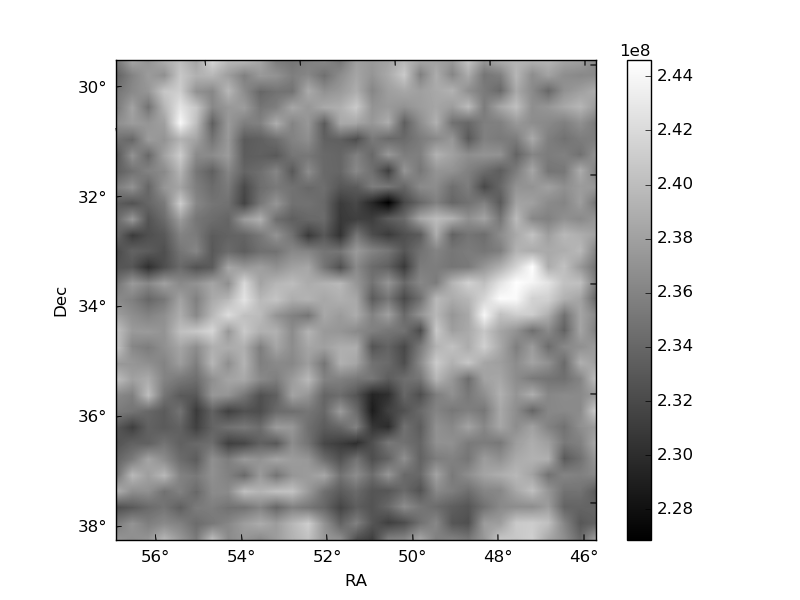
Histogram calculated using DETX and DETY for each event in the final _common_clean file
| Quadrant A |  |
 |
Quadrant B |
|---|---|---|---|
| Quadrant D |  |
 |
Quadrant C |
| Plot type | Count rate plots | Images |
|---|---|---|
| Comparison with Poisson distribution Blue bars denote a histogram of data divided into 1 sec bins. Red curve is a Poisson curve with rate = median count rate of data. |
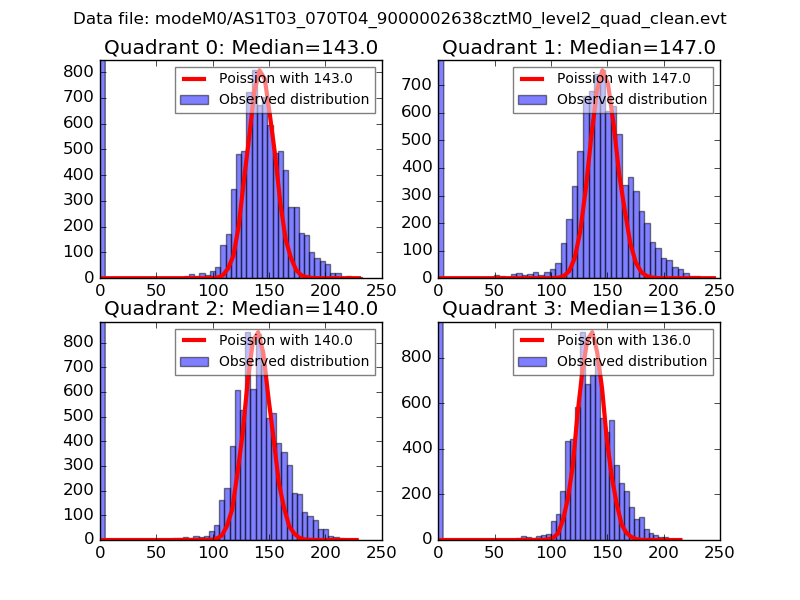 |
 |
| Quadrant-wise count rates Data is divided into 100 sec bins |
 |
|
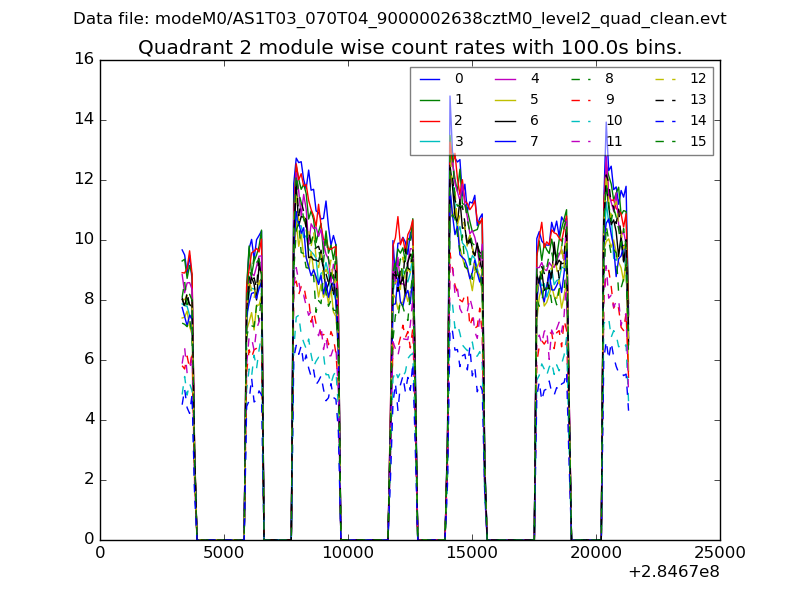
| Module-wise count rates for Quadrant A Data is divided into 100 sec bins |
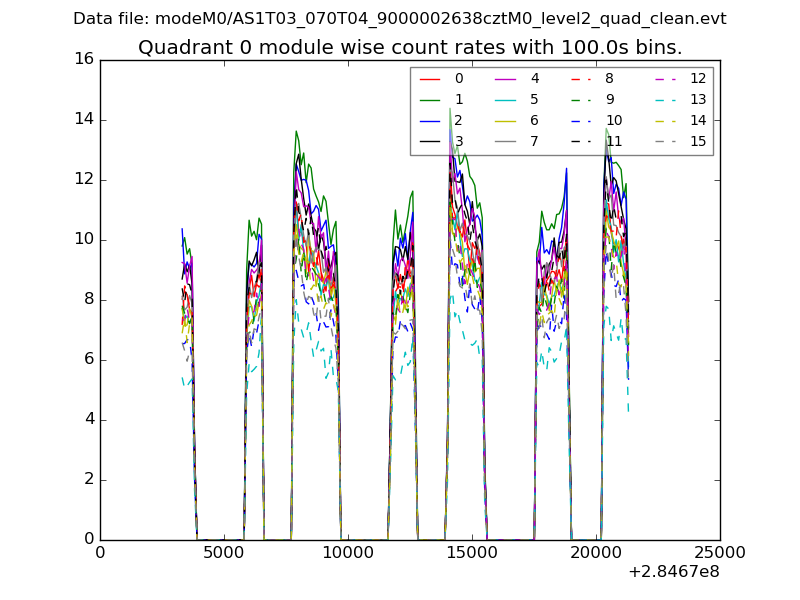 |
 |
| Module-wise count rates for Quadrant B Data is divided into 100 sec bins |
 |
 |
| Module-wise count rates for Quadrant C Data is divided into 100 sec bins |
 |
 |
| Module-wise count rates for Quadrant D Data is divided into 100 sec bins |
 |
 |
| Parameter | Plot |
|---|---|
| CZT HV Monitor |  |
| D_VDD |  |
| Temperature 1 | 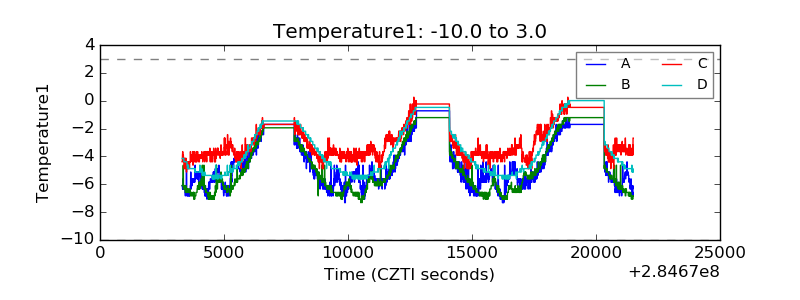 |
| Veto HV Monitor | 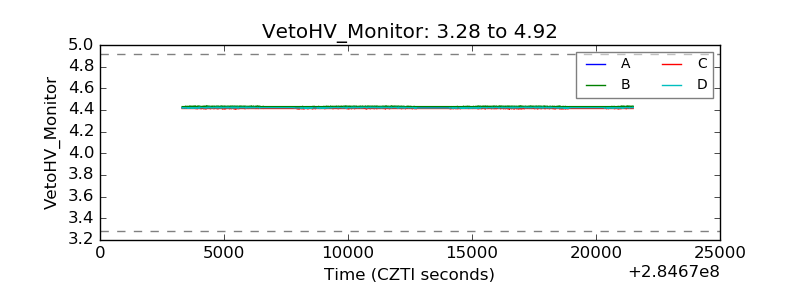 |
| Veto LLD | 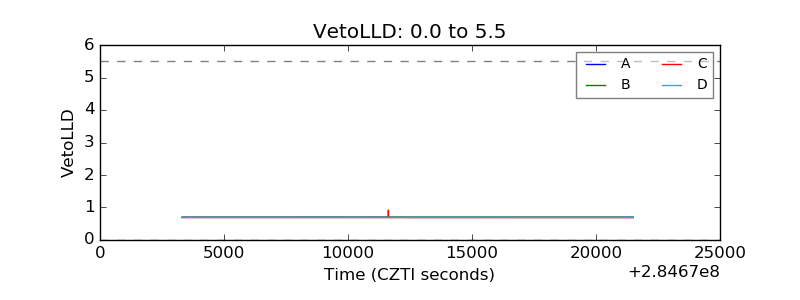 |
| Alpha Counter |  |
| _CPM_Rate | 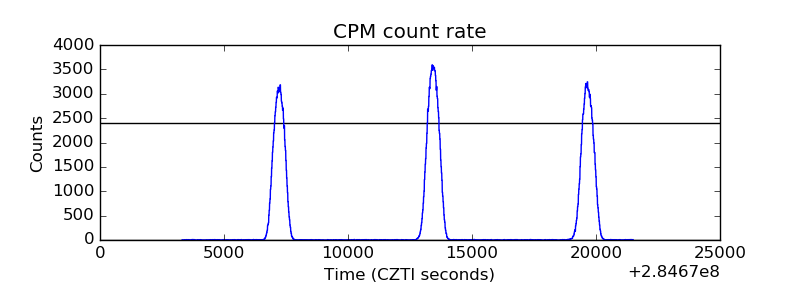 |
| CZT Counter |  |
| +2.5 Volts monitor | 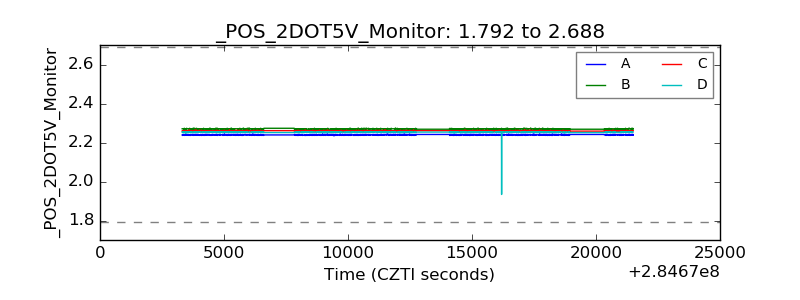 |
| +5 Volts monitor | 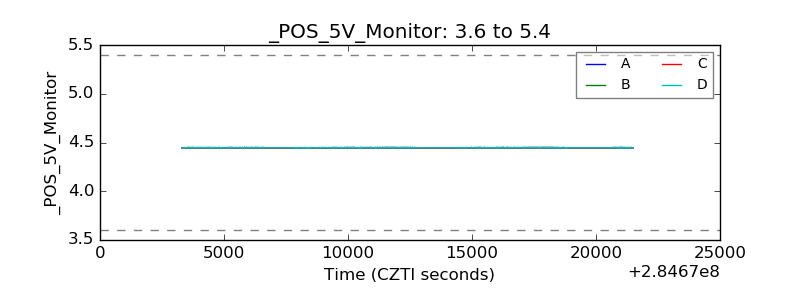 |
| _ROLL_ROT |  |
| _Roll_DEC |  |
| _Roll_RA |  |
| Veto Counter |  |