| Param | Original file | Final file |
|---|---|---|
| Filename | modeM0/AS1T03_070T03_9000002636cztM0_level2_bc.evt | modeM0/AS1T03_070T03_9000002636cztM0_level2_quad_clean.evt |
| Size (bytes) | 296,176,320 | 110,136,960 |
| Size | 282.5 MB | 105.0 MB |
| Events in quadrant A | 1,898,378 | 691,949 |
| Events in quadrant B | 2,259,244 | 669,780 |
| Events in quadrant C | 1,936,353 | 663,905 |
| Events in quadrant D | 2,229,370 | 660,064 |
| Mode SS | |||
|---|---|---|---|
| Quadrant | BADHDUFLAG | Total packets | Discarded packets |
| A | 0 | 192 | 0 |
| B | 0 | 192 | 0 |
| C | 0 | 192 | 0 |
| D | 0 | 192 | 0 |
| Mode M9 | |||
|---|---|---|---|
| Quadrant | BADHDUFLAG | Total packets | Discarded packets |
| A | 0 | 20 | 0 |
| B | 0 | 20 | 0 |
| C | 0 | 20 | 0 |
| D | 0 | 20 | 0 |
| Mode M0 | |||
|---|---|---|---|
| Quadrant | BADHDUFLAG | Total packets | Discarded packets |
| A | 0 | 19335 | 0 |
| B | 0 | 21286 | 0 |
| C | 0 | 19435 | 0 |
| D | 0 | 20416 | 0 |
| Quadrant | Total seconds | Saturated seconds | Saturation percentage |
|---|---|---|---|
| A | 9364 | 68 | 0.726185% |
| B | 9364 | 331 | 3.534814% |
| C | 9364 | 108 | 1.153353% |
| D | 9364 | 119 | 1.270824% |
Noise dominated data is calculated using 1-second bins in cleaned event files. If a bin has >2000 counts, and if more than 50% of those come from <1% of pixels, then it is considered to be noise-dominated and hence unusable.
| Quadrant | # 1 sec bins | Bins with >0 counts | Bins with >2000 counts | High rate bins dominated by noise | Noise dominated (total time) | Noise dominated (detector-on time) | Marked lightcurve |
|---|---|---|---|---|---|---|---|
| A | 11374 | 9363 | 0 | 0 | 0.00% | 0.00% |  |
| B | 11374 | 9364 | 30 | 30 | 0.26% | 0.32% |  |
| C | 11374 | 9365 | 0 | 0 | 0.00% | 0.00% |  |
| D | 11374 | 9364 | 10 | 10 | 0.09% | 0.11% |  |
Top three noisy pixels from each quadrant. If the there are fewer than three noisy pixels in the level2.evt file, extra rows are filled as -1
| Pixel properties | Quadrant properties | ||||||
|---|---|---|---|---|---|---|---|
| Quadrant | DetID | PixID | Counts | Sigma | Mean | Median | Sigma |
| A | 15 | 191 | 43835 | 402.08 | 479 | 468 | 107.9 |
| A | 15 | 174 | 16674 | 150.26 | 479 | 468 | 107.9 |
| A | 0 | 226 | 3180 | 25.14 | 479 | 468 | 107.9 |
| B | 4 | 142 | 263930 | 2829.44 | 472 | 460 | 93.1 |
| B | 10 | 245 | 95209 | 1017.52 | 472 | 460 | 93.1 |
| B | 0 | 197 | 28804 | 304.39 | 472 | 460 | 93.1 |
| C | 5 | 218 | 91025 | 814.26 | 463 | 459 | 111.2 |
| C | 3 | 233 | 34896 | 309.61 | 463 | 459 | 111.2 |
| C | 5 | 219 | 10380 | 89.2 | 463 | 459 | 111.2 |
| D | 1 | 52 | 283333 | 2368.07 | 472 | 457 | 119.5 |
| D | 2 | 234 | 40053 | 331.47 | 472 | 457 | 119.5 |
| D | 7 | 238 | 26377 | 216.99 | 472 | 457 | 119.5 |
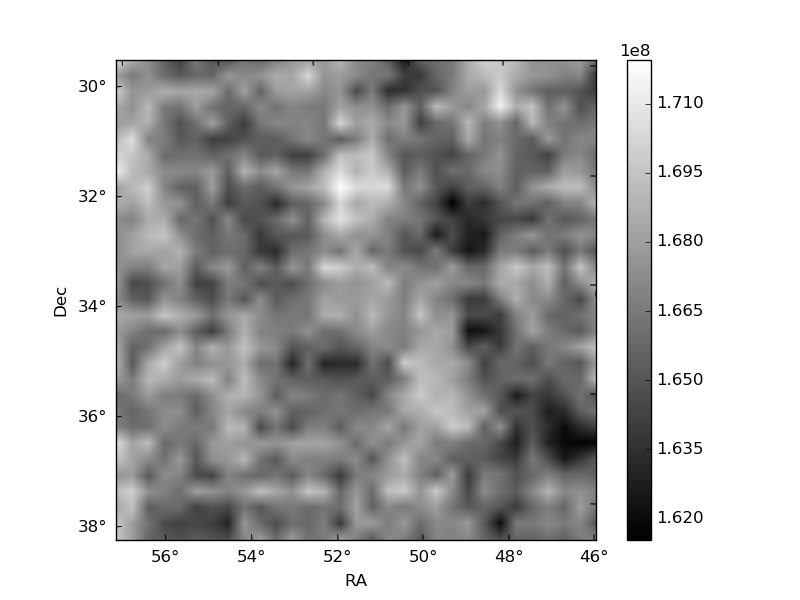
Histogram calculated using DETX and DETY for each event in the final _common_clean file
| Quadrant A |  |
 |
Quadrant B |
|---|---|---|---|
| Quadrant D |  |
 |
Quadrant C |
| Plot type | Count rate plots | Images |
|---|---|---|
| Comparison with Poisson distribution Blue bars denote a histogram of data divided into 1 sec bins. Red curve is a Poisson curve with rate = median count rate of data. |
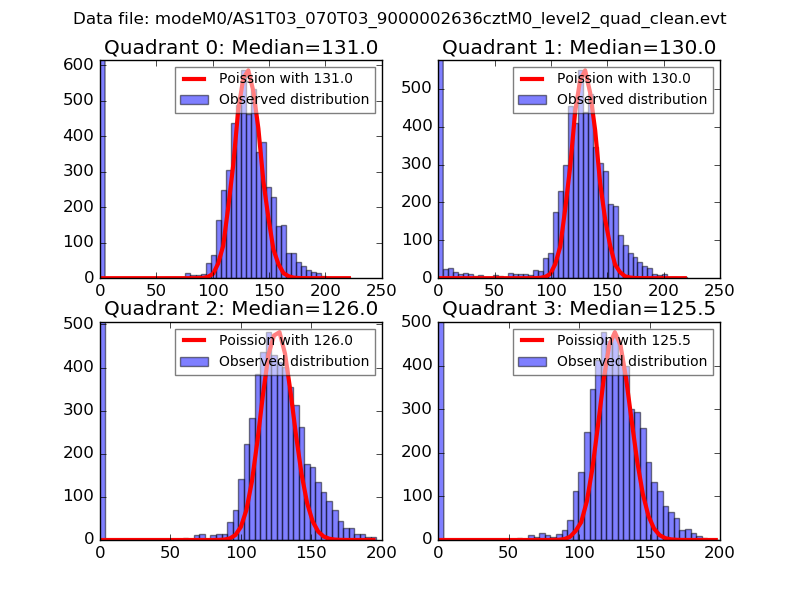 |
 |
| Quadrant-wise count rates Data is divided into 100 sec bins |
 |
|
| Module-wise count rates for Quadrant A Data is divided into 100 sec bins |
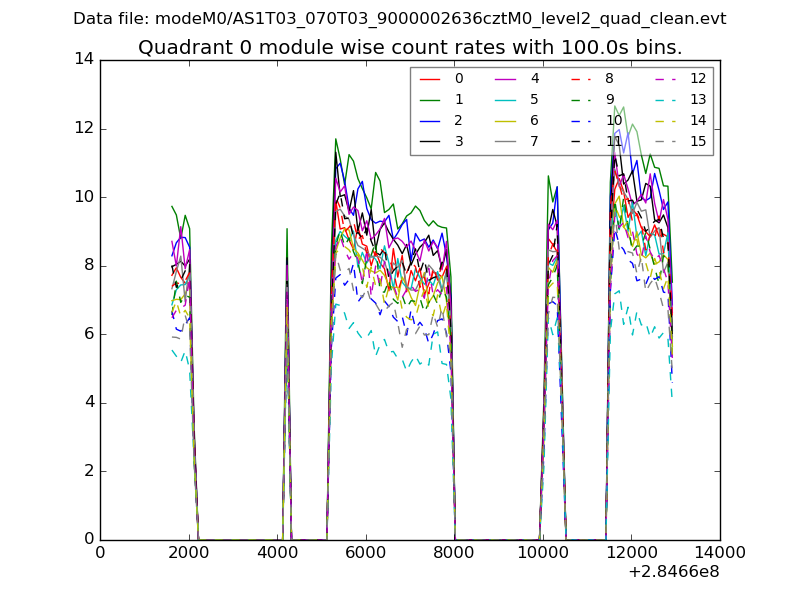 |
 |
| Module-wise count rates for Quadrant B Data is divided into 100 sec bins |
 |
 |
| Module-wise count rates for Quadrant C Data is divided into 100 sec bins |
 |
 |
| Module-wise count rates for Quadrant D Data is divided into 100 sec bins |
 |
 |
| Parameter | Plot |
|---|---|
| CZT HV Monitor |  |
| D_VDD |  |
| Temperature 1 |  |
| Veto HV Monitor | 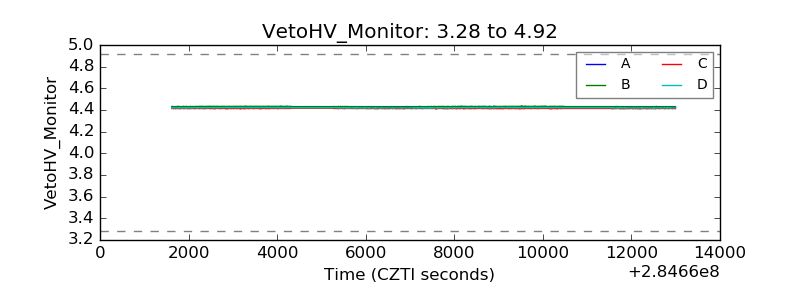 |
| Veto LLD |  |
| Alpha Counter |  |
| _CPM_Rate |  |
| CZT Counter |  |
| +2.5 Volts monitor |  |
| +5 Volts monitor |  |
| _ROLL_ROT |  |
| _Roll_DEC | 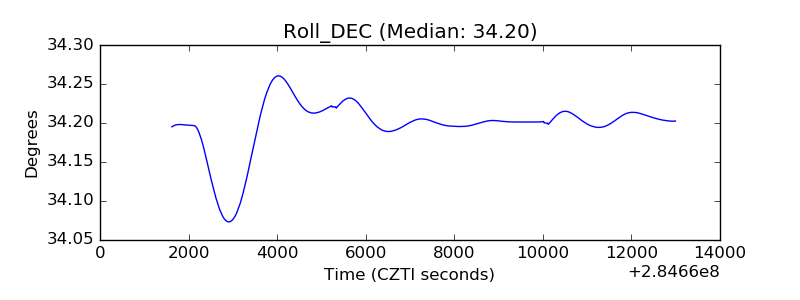 |
| _Roll_RA |  |
| Veto Counter | 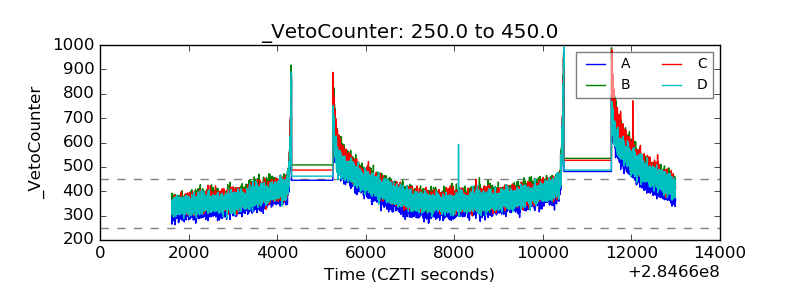 |