| Param | Original file | Final file |
|---|---|---|
| Filename | modeM0/AS1T03_070T02_9000002634cztM0_level2_bc.evt | modeM0/AS1T03_070T02_9000002634cztM0_level2_quad_clean.evt |
| Size (bytes) | 304,934,400 | 126,336,960 |
| Size | 290.8 MB | 120.5 MB |
| Events in quadrant A | 1,948,233 | 796,102 |
| Events in quadrant B | 2,087,557 | 797,470 |
| Events in quadrant C | 1,927,683 | 767,999 |
| Events in quadrant D | 2,578,751 | 768,658 |
| Mode M9 | |||
|---|---|---|---|
| Quadrant | BADHDUFLAG | Total packets | Discarded packets |
| A | 0 | 13 | 0 |
| B | 0 | 13 | 0 |
| C | 0 | 13 | 0 |
| D | 0 | 13 | 0 |
| Mode SS | |||
|---|---|---|---|
| Quadrant | BADHDUFLAG | Total packets | Discarded packets |
| A | 0 | 206 | 0 |
| B | 0 | 206 | 0 |
| C | 0 | 206 | 0 |
| D | 0 | 206 | 0 |
| Mode M0 | |||
|---|---|---|---|
| Quadrant | BADHDUFLAG | Total packets | Discarded packets |
| A | 0 | 20576 | 0 |
| B | 0 | 20913 | 0 |
| C | 0 | 20479 | 0 |
| D | 0 | 22338 | 0 |
| Quadrant | Total seconds | Saturated seconds | Saturation percentage |
|---|---|---|---|
| A | 10041 | 102 | 1.015835% |
| B | 10041 | 136 | 1.354447% |
| C | 10041 | 131 | 1.304651% |
| D | 10041 | 148 | 1.473957% |
Noise dominated data is calculated using 1-second bins in cleaned event files. If a bin has >2000 counts, and if more than 50% of those come from <1% of pixels, then it is considered to be noise-dominated and hence unusable.
| Quadrant | # 1 sec bins | Bins with >0 counts | Bins with >2000 counts | High rate bins dominated by noise | Noise dominated (total time) | Noise dominated (detector-on time) | Marked lightcurve |
|---|---|---|---|---|---|---|---|
| A | 11401 | 10039 | 0 | 0 | 0.00% | 0.00% |  |
| B | 11401 | 10039 | 0 | 0 | 0.00% | 0.00% |  |
| C | 11401 | 10039 | 0 | 0 | 0.00% | 0.00% |  |
| D | 11401 | 10039 | 9 | 9 | 0.08% | 0.09% |  |
Top three noisy pixels from each quadrant. If the there are fewer than three noisy pixels in the level2.evt file, extra rows are filled as -1
| Pixel properties | Quadrant properties | ||||||
|---|---|---|---|---|---|---|---|
| Quadrant | DetID | PixID | Counts | Sigma | Mean | Median | Sigma |
| A | 15 | 174 | 46478 | 417.22 | 492 | 481 | 110.2 |
| A | 15 | 31 | 8156 | 69.62 | 492 | 481 | 110.2 |
| A | 15 | 191 | 3500 | 27.38 | 492 | 481 | 110.2 |
| B | 7 | 220 | 61090 | 623.92 | 495 | 482 | 97.1 |
| B | 10 | 245 | 31319 | 317.45 | 495 | 482 | 97.1 |
| B | 0 | 229 | 20026 | 201.19 | 495 | 482 | 97.1 |
| C | 5 | 218 | 53293 | 459.88 | 477 | 471 | 114.9 |
| C | 3 | 233 | 27329 | 233.83 | 477 | 471 | 114.9 |
| C | 0 | 207 | 3630 | 27.5 | 477 | 471 | 114.9 |
| D | 1 | 52 | 400132 | 3195.2 | 487 | 470 | 125.1 |
| D | 7 | 238 | 156343 | 1246.17 | 487 | 470 | 125.1 |
| D | 2 | 234 | 47994 | 379.94 | 487 | 470 | 125.1 |
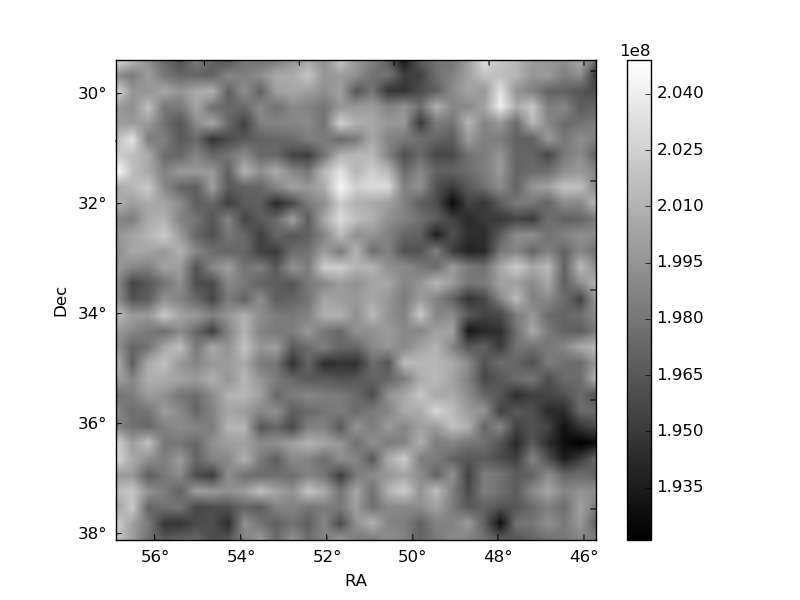
Histogram calculated using DETX and DETY for each event in the final _common_clean file
| Quadrant A |  |
 |
Quadrant B |
|---|---|---|---|
| Quadrant D |  |
 |
Quadrant C |
| Plot type | Count rate plots | Images |
|---|---|---|
| Comparison with Poisson distribution Blue bars denote a histogram of data divided into 1 sec bins. Red curve is a Poisson curve with rate = median count rate of data. |
 |
 |
| Quadrant-wise count rates Data is divided into 100 sec bins |
 |
|
| Module-wise count rates for Quadrant A Data is divided into 100 sec bins |
 |
 |
| Module-wise count rates for Quadrant B Data is divided into 100 sec bins |
 |
 |
| Module-wise count rates for Quadrant C Data is divided into 100 sec bins |
 |
 |
| Module-wise count rates for Quadrant D Data is divided into 100 sec bins |
 |
 |
| Parameter | Plot |
|---|---|
| CZT HV Monitor | 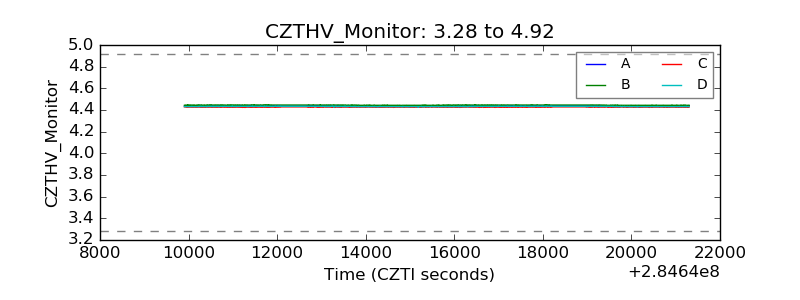 |
| D_VDD |  |
| Temperature 1 | 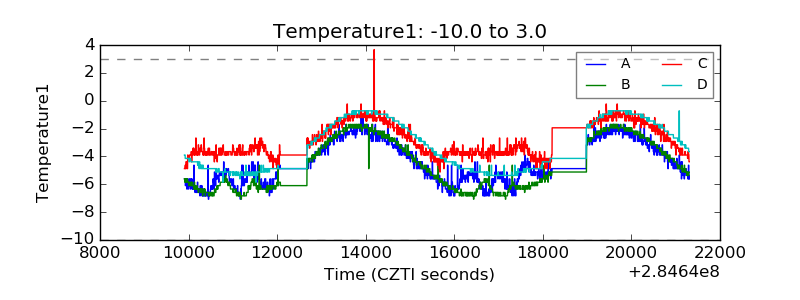 |
| Veto HV Monitor |  |
| Veto LLD |  |
| Alpha Counter |  |
| _CPM_Rate | 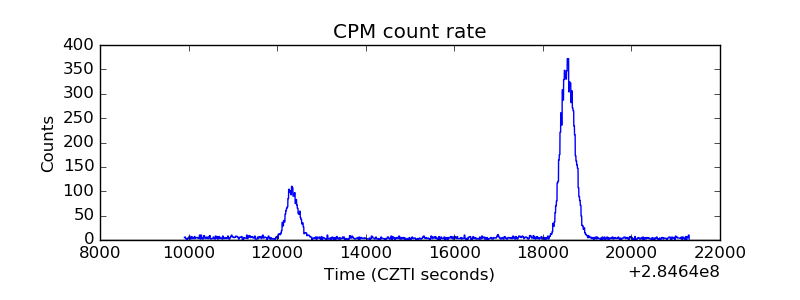 |
| CZT Counter |  |
| +2.5 Volts monitor | 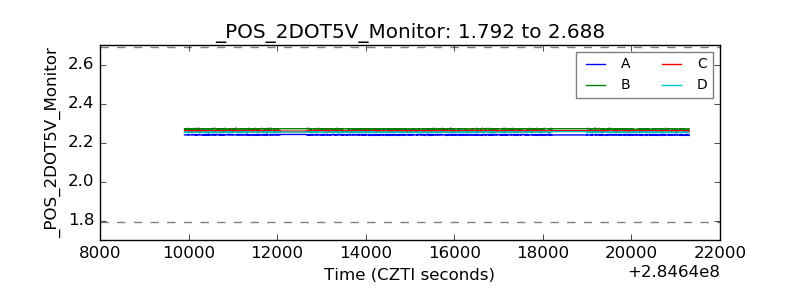 |
| +5 Volts monitor | 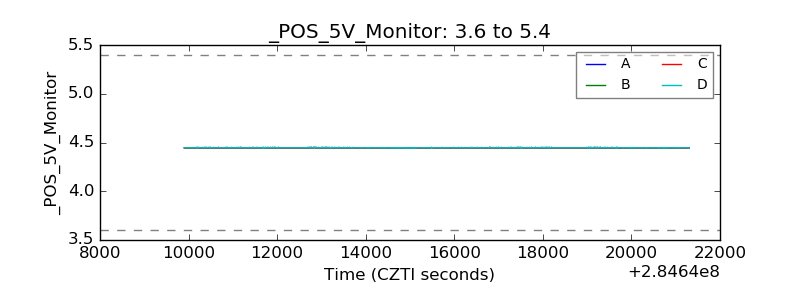 |
| _ROLL_ROT |  |
| _Roll_DEC |  |
| _Roll_RA |  |
| Veto Counter |  |