| Param | Original file | Final file |
|---|---|---|
| Filename | modeM0/AS1T03_070T01_9000002632cztM0_level2_bc.evt | modeM0/AS1T03_070T01_9000002632cztM0_level2_quad_clean.evt |
| Size (bytes) | 317,563,200 | 125,683,200 |
| Size | 302.9 MB | 119.9 MB |
| Events in quadrant A | 2,016,183 | 789,909 |
| Events in quadrant B | 2,263,535 | 795,111 |
| Events in quadrant C | 1,916,182 | 770,889 |
| Events in quadrant D | 2,735,445 | 761,331 |
| Mode M0 | |||
|---|---|---|---|
| Quadrant | BADHDUFLAG | Total packets | Discarded packets |
| A | 0 | 21029 | 0 |
| B | 0 | 21674 | 0 |
| C | 0 | 20632 | 0 |
| D | 0 | 23143 | 0 |
| Mode SS | |||
|---|---|---|---|
| Quadrant | BADHDUFLAG | Total packets | Discarded packets |
| A | 0 | 202 | 0 |
| B | 0 | 202 | 0 |
| C | 0 | 202 | 0 |
| D | 0 | 202 | 0 |
| Mode M9 | |||
|---|---|---|---|
| Quadrant | BADHDUFLAG | Total packets | Discarded packets |
| A | 0 | 5 | 0 |
| B | 0 | 5 | 0 |
| C | 0 | 5 | 0 |
| D | 0 | 5 | 0 |
| Quadrant | Total seconds | Saturated seconds | Saturation percentage |
|---|---|---|---|
| A | 9946 | 396 | 3.981500% |
| B | 9946 | 422 | 4.242912% |
| C | 9946 | 372 | 3.740197% |
| D | 9946 | 425 | 4.273075% |
Noise dominated data is calculated using 1-second bins in cleaned event files. If a bin has >2000 counts, and if more than 50% of those come from <1% of pixels, then it is considered to be noise-dominated and hence unusable.
| Quadrant | # 1 sec bins | Bins with >0 counts | Bins with >2000 counts | High rate bins dominated by noise | Noise dominated (total time) | Noise dominated (detector-on time) | Marked lightcurve |
|---|---|---|---|---|---|---|---|
| A | 10346 | 9946 | 2 | 2 | 0.02% | 0.02% |  |
| B | 10346 | 9947 | 8 | 8 | 0.08% | 0.08% | 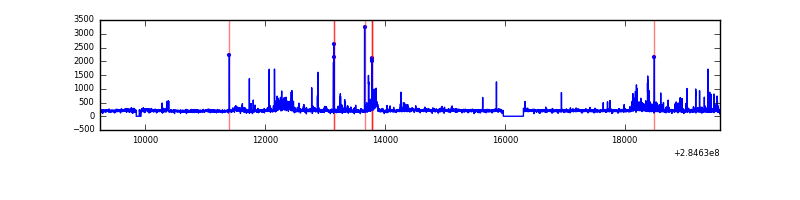 |
| C | 10346 | 9948 | 0 | 0 | 0.00% | 0.00% |  |
| D | 10346 | 9947 | 22 | 22 | 0.21% | 0.22% |  |
Top three noisy pixels from each quadrant. If the there are fewer than three noisy pixels in the level2.evt file, extra rows are filled as -1
| Pixel properties | Quadrant properties | ||||||
|---|---|---|---|---|---|---|---|
| Quadrant | DetID | PixID | Counts | Sigma | Mean | Median | Sigma |
| A | 15 | 174 | 126166 | 1145.76 | 482 | 469 | 109.7 |
| A | 14 | 237 | 34543 | 310.59 | 482 | 469 | 109.7 |
| A | 15 | 31 | 5521 | 46.05 | 482 | 469 | 109.7 |
| B | 7 | 220 | 112232 | 1164.4 | 486 | 472 | 96.0 |
| B | 0 | 219 | 79385 | 822.17 | 486 | 472 | 96.0 |
| B | 10 | 245 | 72332 | 748.69 | 486 | 472 | 96.0 |
| C | 5 | 218 | 38659 | 335.95 | 470 | 465 | 113.7 |
| C | 3 | 233 | 38313 | 332.91 | 470 | 465 | 113.7 |
| C | 8 | 128 | 10690 | 89.94 | 470 | 465 | 113.7 |
| D | 7 | 223 | 341494 | 2749.23 | 475 | 460 | 124.0 |
| D | 1 | 52 | 283150 | 2278.89 | 475 | 460 | 124.0 |
| D | 10 | 70 | 117366 | 942.43 | 475 | 460 | 124.0 |
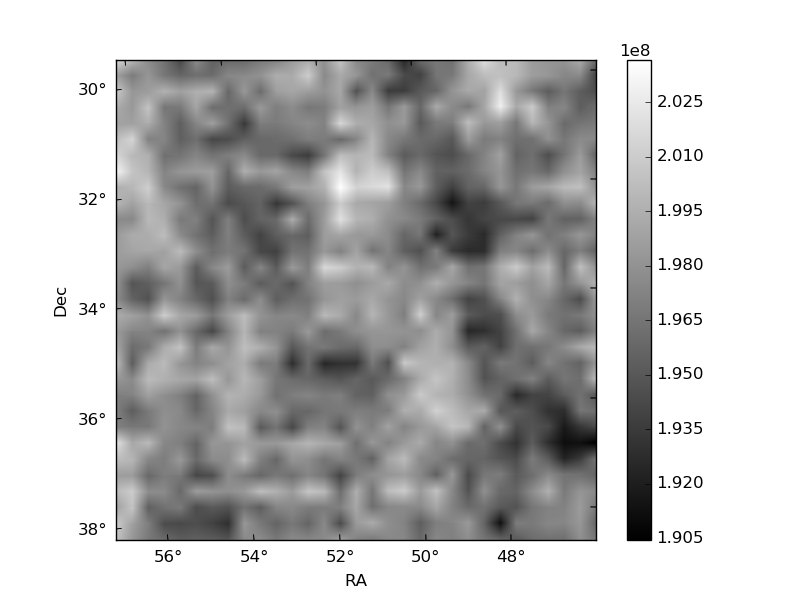
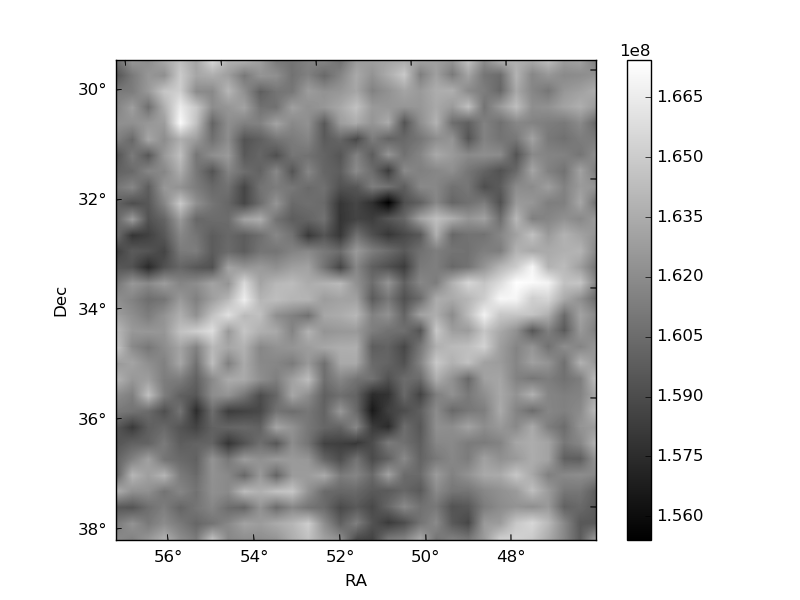
Histogram calculated using DETX and DETY for each event in the final _common_clean file
| Quadrant A |  |
 |
Quadrant B |
|---|---|---|---|
| Quadrant D |  |
 |
Quadrant C |
| Plot type | Count rate plots | Images |
|---|---|---|
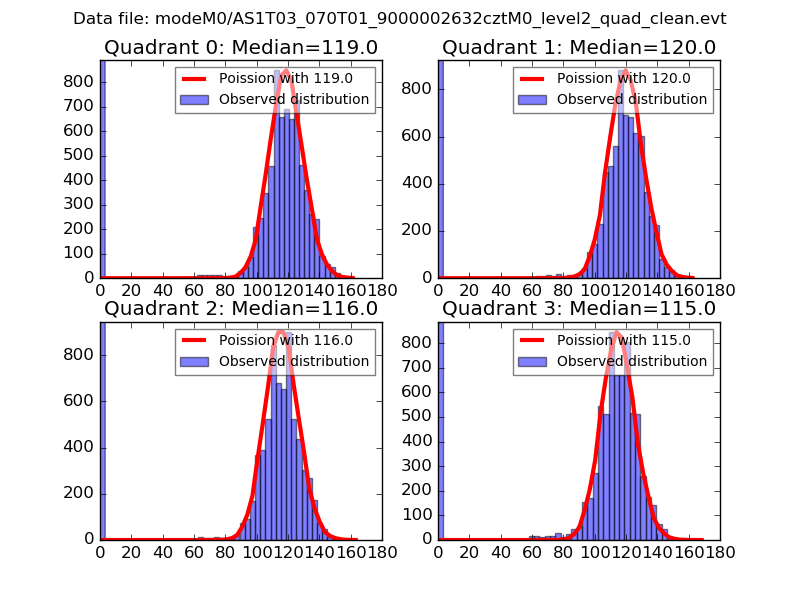
| Comparison with Poisson distribution Blue bars denote a histogram of data divided into 1 sec bins. Red curve is a Poisson curve with rate = median count rate of data. |
 |
 |
| Quadrant-wise count rates Data is divided into 100 sec bins |
 |
|
| Module-wise count rates for Quadrant A Data is divided into 100 sec bins |
 |
 |
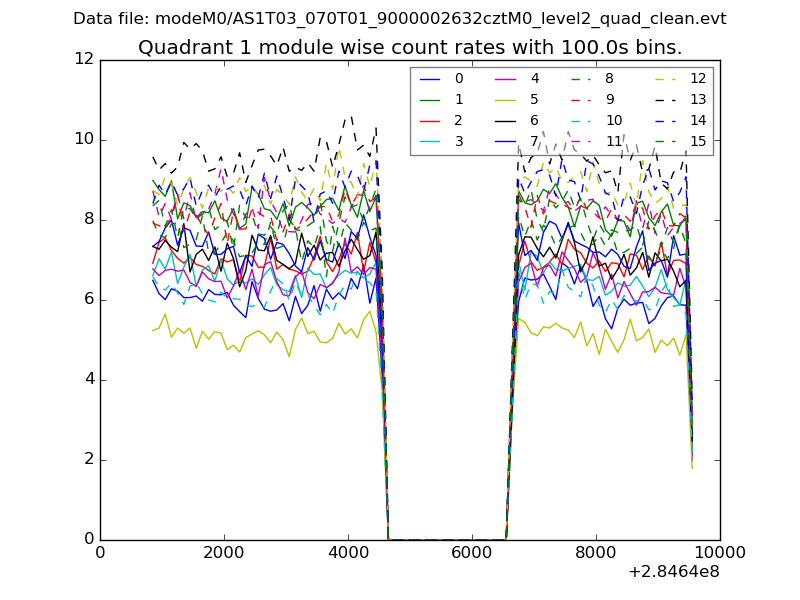
| Module-wise count rates for Quadrant B Data is divided into 100 sec bins |
 |
 |
| Module-wise count rates for Quadrant C Data is divided into 100 sec bins |
 |
 |
| Module-wise count rates for Quadrant D Data is divided into 100 sec bins |
 |
 |
| Parameter | Plot |
|---|---|
| CZT HV Monitor |  |
| D_VDD |  |
| Temperature 1 |  |
| Veto HV Monitor |  |
| Veto LLD |  |
| Alpha Counter |  |
| _CPM_Rate | 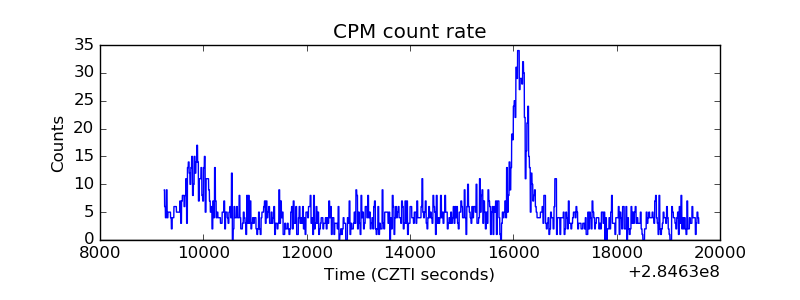 |
| CZT Counter |  |
| +2.5 Volts monitor |  |
| +5 Volts monitor | 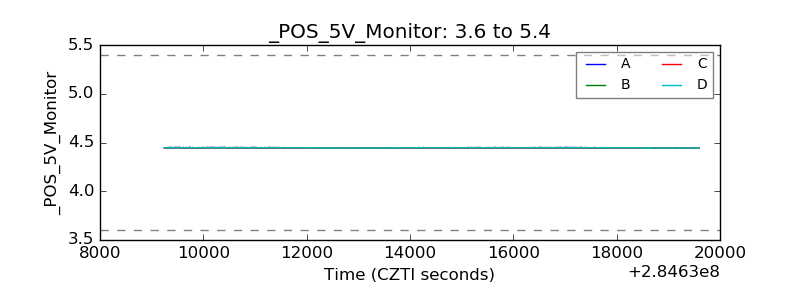 |
| _ROLL_ROT | 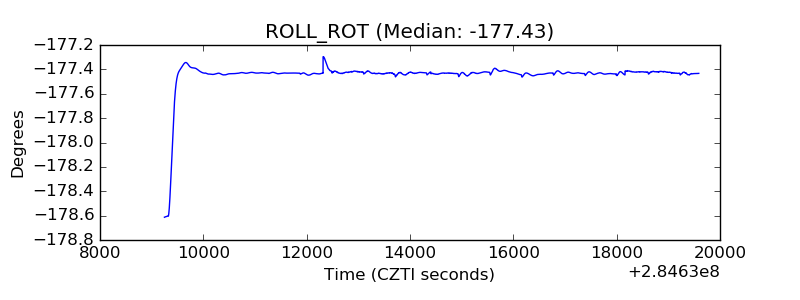 |
| _Roll_DEC | 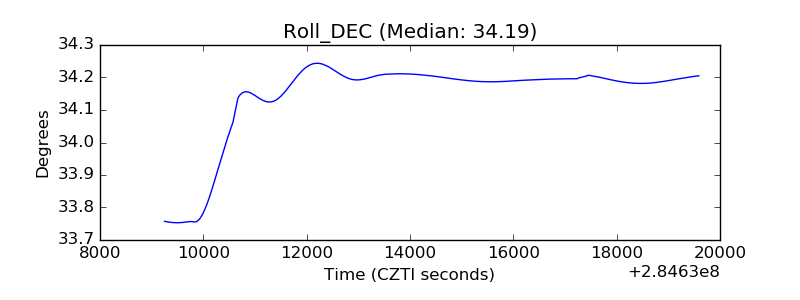 |
| _Roll_RA | 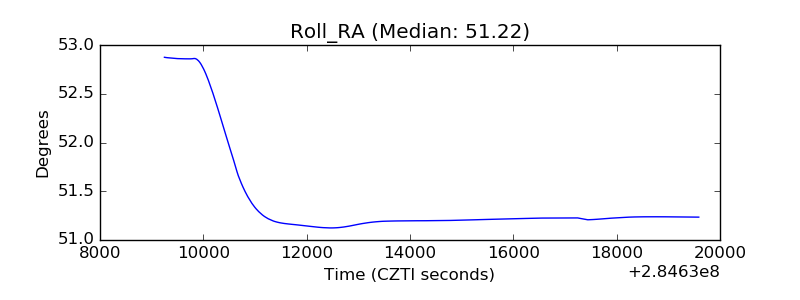 |
| Veto Counter |  |