| Param | Original file | Final file |
|---|---|---|
| Filename | modeM0/AS1T03_042T01_9000002630cztM0_level2_bc.evt | modeM0/AS1T03_042T01_9000002630cztM0_level2_quad_clean.evt |
| Size (bytes) | 5,158,771,200 | 1,588,337,280 |
| Size | 4.8 GB | 1.5 GB |
| Events in quadrant A | 26,697,192 | 10,333,297 |
| Events in quadrant B | 25,507,820 | 10,648,954 |
| Events in quadrant C | 24,818,316 | 10,167,716 |
| Events in quadrant D | 71,076,558 | 8,773,557 |
| Mode M0 | |||
|---|---|---|---|
| Quadrant | BADHDUFLAG | Total packets | Discarded packets |
| A | 0 | 256778 | 0 |
| B | 0 | 250071 | 0 |
| C | 0 | 249347 | 0 |
| D | 0 | 451565 | 0 |
| Mode M9 | |||
|---|---|---|---|
| Quadrant | BADHDUFLAG | Total packets | Discarded packets |
| A | 0 | 204 | 0 |
| B | 0 | 204 | 0 |
| C | 0 | 204 | 0 |
| D | 0 | 204 | 0 |
| Mode SS | |||
|---|---|---|---|
| Quadrant | BADHDUFLAG | Total packets | Discarded packets |
| A | 0 | 2434 | 0 |
| B | 0 | 2434 | 0 |
| C | 0 | 2434 | 0 |
| D | 0 | 2434 | 0 |
| Quadrant | Total seconds | Saturated seconds | Saturation percentage |
|---|---|---|---|
| A | 119390 | 2100 | 1.758941% |
| B | 119390 | 1469 | 1.230421% |
| C | 119390 | 1736 | 1.454058% |
| D | 119390 | 24702 | 20.690175% |
Noise dominated data is calculated using 1-second bins in cleaned event files. If a bin has >2000 counts, and if more than 50% of those come from <1% of pixels, then it is considered to be noise-dominated and hence unusable.
| Quadrant | # 1 sec bins | Bins with >0 counts | Bins with >2000 counts | High rate bins dominated by noise | Noise dominated (total time) | Noise dominated (detector-on time) | Marked lightcurve |
|---|---|---|---|---|---|---|---|
| A | 139720 | 119390 | 93 | 93 | 0.07% | 0.08% |  |
| B | 139720 | 119394 | 22 | 22 | 0.02% | 0.02% |  |
| C | 139720 | 119390 | 0 | 0 | 0.00% | 0.00% |  |
| D | 139720 | 119377 | 3751 | 3751 | 2.68% | 3.14% |  |
Top three noisy pixels from each quadrant. If the there are fewer than three noisy pixels in the level2.evt file, extra rows are filled as -1
| Pixel properties | Quadrant properties | ||||||
|---|---|---|---|---|---|---|---|
| Quadrant | DetID | PixID | Counts | Sigma | Mean | Median | Sigma |
| A | 15 | 174 | 2570306 | 1912.14 | 6177 | 6058 | 1341.0 |
| A | 15 | 31 | 185119 | 133.52 | 6177 | 6058 | 1341.0 |
| A | 12 | 16 | 125954 | 89.41 | 6177 | 6058 | 1341.0 |
| B | 10 | 245 | 440068 | 366.49 | 6304 | 6134 | 1184.0 |
| B | 0 | 219 | 238321 | 196.1 | 6304 | 6134 | 1184.0 |
| B | 0 | 189 | 197669 | 161.76 | 6304 | 6134 | 1184.0 |
| C | 3 | 233 | 1098423 | 779.6 | 6009 | 5979 | 1401.3 |
| C | 5 | 218 | 462337 | 325.67 | 6009 | 5979 | 1401.3 |
| C | 0 | 207 | 78821 | 51.98 | 6009 | 5979 | 1401.3 |
| D | 7 | 238 | 46747488 | 33448.92 | 5358 | 5204 | 1397.4 |
| D | 1 | 52 | 1175643 | 837.57 | 5358 | 5204 | 1397.4 |
| D | 13 | 232 | 805054 | 572.38 | 5358 | 5204 | 1397.4 |
Histogram calculated using DETX and DETY for each event in the final _common_clean file
| Quadrant A | 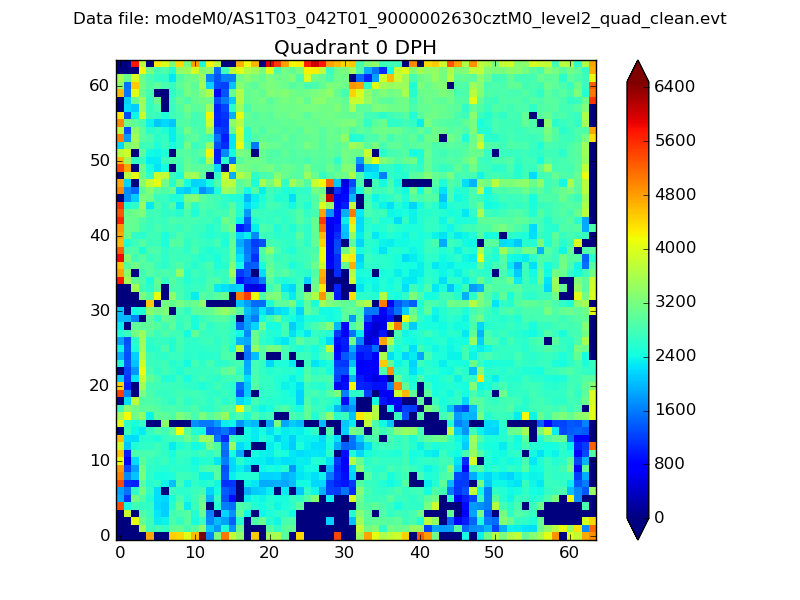 |
 |
Quadrant B |
|---|---|---|---|
| Quadrant D | 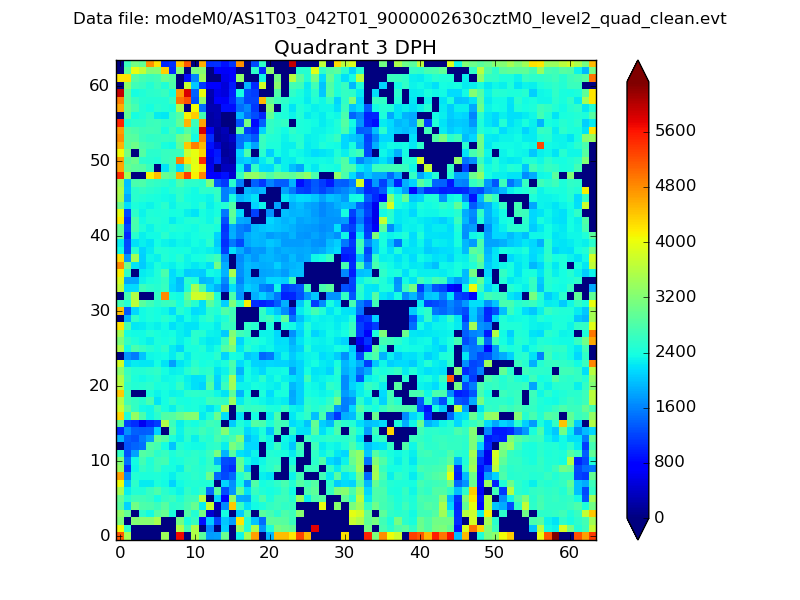 |
 |
Quadrant C |
| Plot type | Count rate plots | Images |
|---|---|---|
| Comparison with Poisson distribution Blue bars denote a histogram of data divided into 1 sec bins. Red curve is a Poisson curve with rate = median count rate of data. |
 |
 |
| Quadrant-wise count rates Data is divided into 100 sec bins |
 |
|
| Module-wise count rates for Quadrant A Data is divided into 100 sec bins |
 |
 |
| Module-wise count rates for Quadrant B Data is divided into 100 sec bins |
 |
 |
| Module-wise count rates for Quadrant C Data is divided into 100 sec bins |
 |
 |
| Module-wise count rates for Quadrant D Data is divided into 100 sec bins |
 |
 |
| Parameter | Plot |
|---|---|
| CZT HV Monitor |  |
| D_VDD |  |
| Temperature 1 | 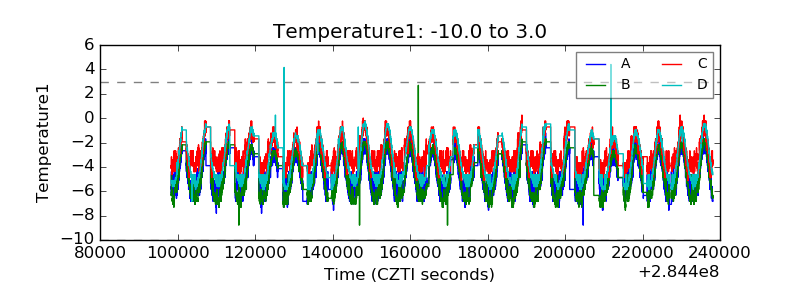 |
| Veto HV Monitor | 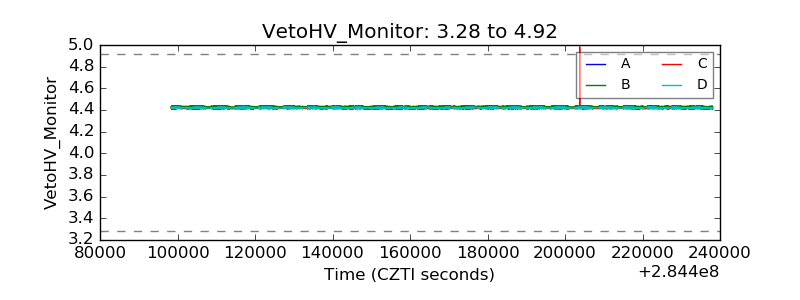 |
| Veto LLD |  |
| Alpha Counter |  |
| _CPM_Rate |  |
| CZT Counter |  |
| +2.5 Volts monitor |  |
| +5 Volts monitor |  |
| _ROLL_ROT |  |
| _Roll_DEC | 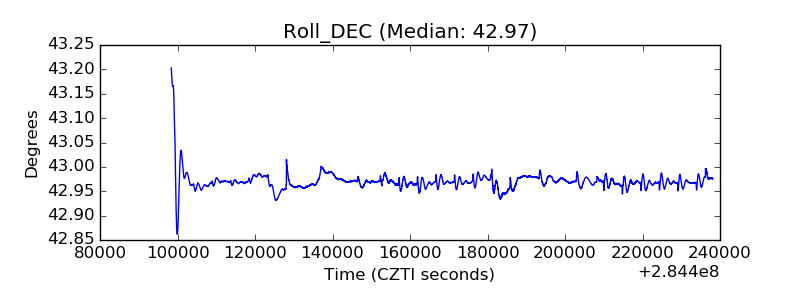 |
| _Roll_RA |  |
| Veto Counter |  |