| Param | Original file | Final file |
|---|---|---|
| Filename | modeM0/AS1T03_040T01_9000002628cztM0_level2_bc.evt | modeM0/AS1T03_040T01_9000002628cztM0_level2_quad_clean.evt |
| Size (bytes) | 2,753,380,800 | 896,641,920 |
| Size | 2.6 GB | 855.1 MB |
| Events in quadrant A | 14,487,427 | 5,749,974 |
| Events in quadrant B | 16,873,322 | 5,848,737 |
| Events in quadrant C | 15,379,654 | 5,619,261 |
| Events in quadrant D | 31,929,296 | 5,193,996 |
| Mode M9 | |||
|---|---|---|---|
| Quadrant | BADHDUFLAG | Total packets | Discarded packets |
| A | 0 | 107 | 0 |
| B | 0 | 107 | 0 |
| C | 0 | 107 | 0 |
| D | 0 | 107 | 0 |
| Mode SS | |||
|---|---|---|---|
| Quadrant | BADHDUFLAG | Total packets | Discarded packets |
| A | 0 | 1416 | 0 |
| B | 0 | 1416 | 0 |
| C | 0 | 1416 | 0 |
| D | 0 | 1416 | 0 |
| Mode M0 | |||
|---|---|---|---|
| Quadrant | BADHDUFLAG | Total packets | Discarded packets |
| A | 0 | 145402 | 0 |
| B | 0 | 152150 | 0 |
| C | 0 | 145813 | 0 |
| D | 0 | 217747 | 0 |
| Quadrant | Total seconds | Saturated seconds | Saturation percentage |
|---|---|---|---|
| A | 69174 | 1086 | 1.569954% |
| B | 69174 | 1335 | 1.929916% |
| C | 69174 | 1122 | 1.621997% |
| D | 69174 | 8057 | 11.647440% |
Noise dominated data is calculated using 1-second bins in cleaned event files. If a bin has >2000 counts, and if more than 50% of those come from <1% of pixels, then it is considered to be noise-dominated and hence unusable.
| Quadrant | # 1 sec bins | Bins with >0 counts | Bins with >2000 counts | High rate bins dominated by noise | Noise dominated (total time) | Noise dominated (detector-on time) | Marked lightcurve |
|---|---|---|---|---|---|---|---|
| A | 80205 | 69175 | 30 | 30 | 0.04% | 0.04% |  |
| B | 80205 | 69174 | 120 | 120 | 0.15% | 0.17% |  |
| C | 80205 | 69174 | 1 | 1 | 0.00% | 0.00% | 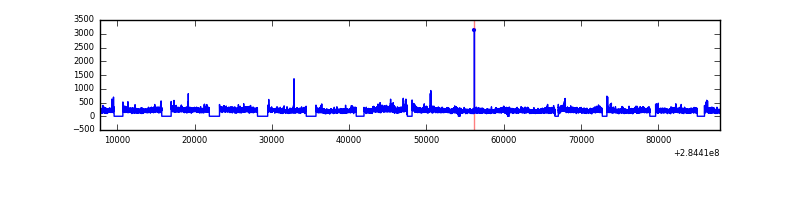 |
| D | 80205 | 69166 | 857 | 857 | 1.07% | 1.24% | 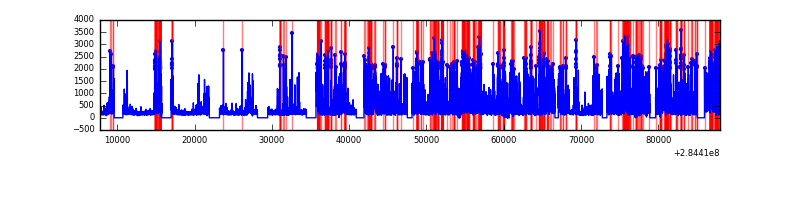 |
Top three noisy pixels from each quadrant. If the there are fewer than three noisy pixels in the level2.evt file, extra rows are filled as -1
| Pixel properties | Quadrant properties | ||||||
|---|---|---|---|---|---|---|---|
| Quadrant | DetID | PixID | Counts | Sigma | Mean | Median | Sigma |
| A | 15 | 174 | 862809 | 1103.51 | 3547 | 3475 | 778.7 |
| A | 12 | 194 | 23800 | 26.1 | 3547 | 3475 | 778.7 |
| A | 0 | 226 | 23267 | 25.42 | 3547 | 3475 | 778.7 |
| B | 10 | 245 | 1642166 | 2405.29 | 3592 | 3495 | 681.3 |
| B | 0 | 189 | 515385 | 751.37 | 3592 | 3495 | 681.3 |
| B | 0 | 197 | 174852 | 251.52 | 3592 | 3495 | 681.3 |
| C | 3 | 233 | 1699354 | 2126.64 | 3424 | 3398 | 797.5 |
| C | 5 | 218 | 363535 | 451.59 | 3424 | 3398 | 797.5 |
| C | 1 | 16 | 73109 | 87.41 | 3424 | 3398 | 797.5 |
| D | 7 | 238 | 18115583 | 23433.76 | 3307 | 3189 | 772.9 |
| D | 2 | 234 | 258115 | 329.82 | 3307 | 3189 | 772.9 |
| D | 1 | 52 | 192991 | 245.57 | 3307 | 3189 | 772.9 |
Histogram calculated using DETX and DETY for each event in the final _common_clean file
| Quadrant A | 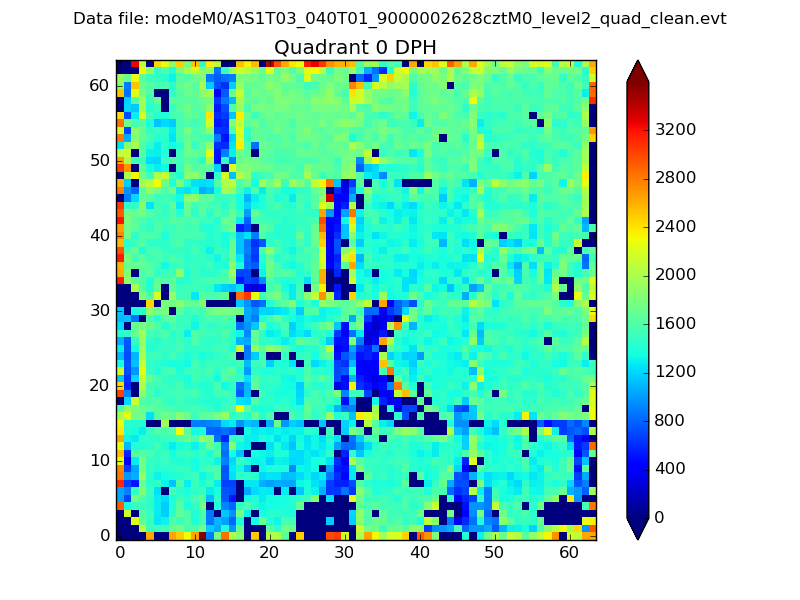 |
 |
Quadrant B |
|---|---|---|---|
| Quadrant D |  |
 |
Quadrant C |
| Plot type | Count rate plots | Images |
|---|---|---|
| Comparison with Poisson distribution Blue bars denote a histogram of data divided into 1 sec bins. Red curve is a Poisson curve with rate = median count rate of data. |
 |
 |
| Quadrant-wise count rates Data is divided into 100 sec bins |
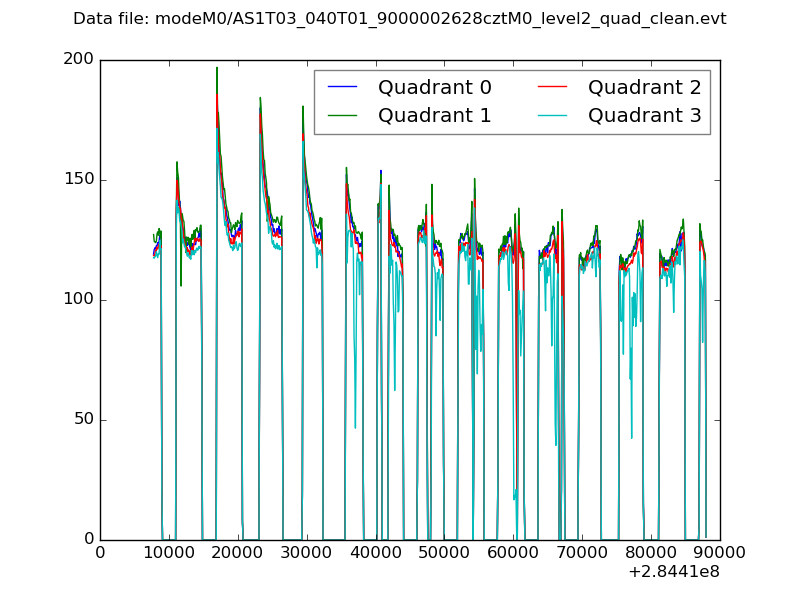 |
|
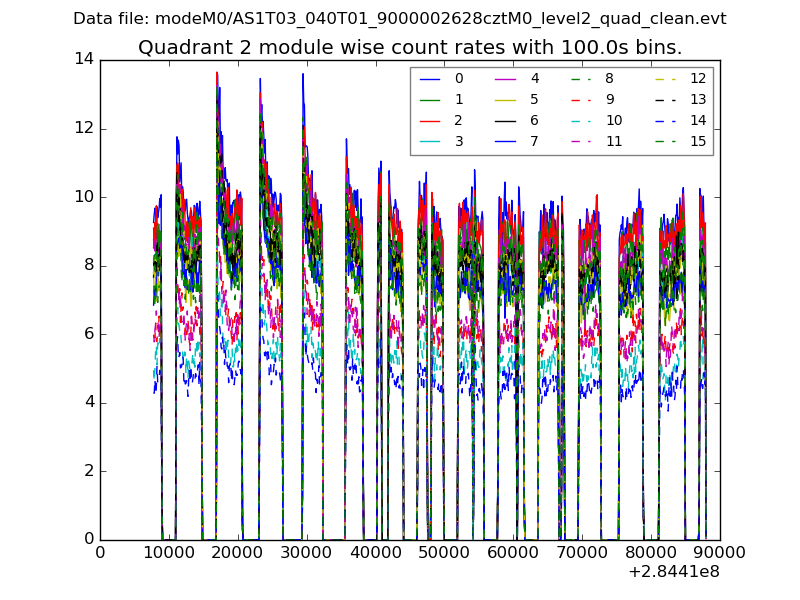
| Module-wise count rates for Quadrant A Data is divided into 100 sec bins |
 |
 |
| Module-wise count rates for Quadrant B Data is divided into 100 sec bins |
 |
 |
| Module-wise count rates for Quadrant C Data is divided into 100 sec bins |
 |
 |
| Module-wise count rates for Quadrant D Data is divided into 100 sec bins |
 |
 |
| Parameter | Plot |
|---|---|
| CZT HV Monitor |  |
| D_VDD | 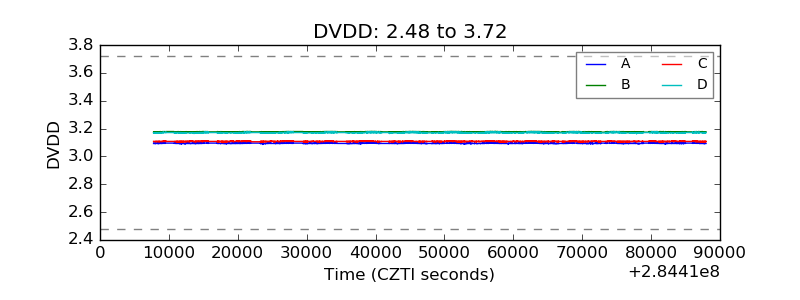 |
| Temperature 1 | 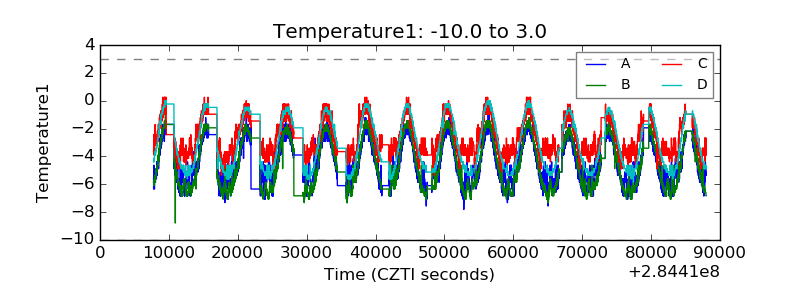 |
| Veto HV Monitor | 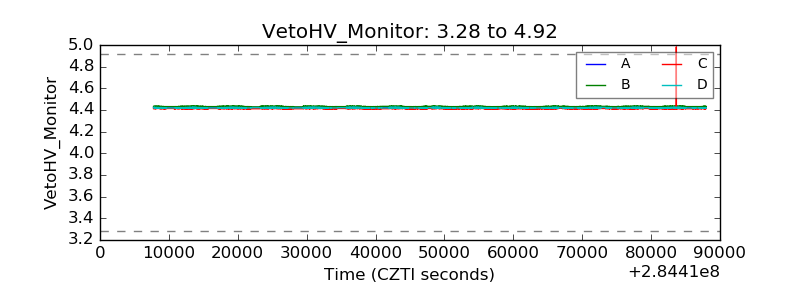 |
| Veto LLD |  |
| Alpha Counter |  |
| _CPM_Rate | 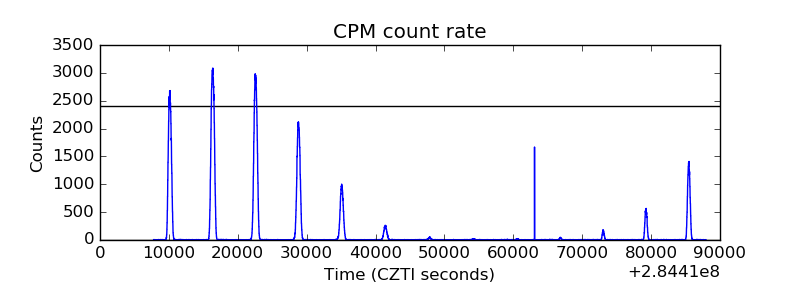 |
| CZT Counter |  |
| +2.5 Volts monitor |  |
| +5 Volts monitor |  |
| _ROLL_ROT |  |
| _Roll_DEC | 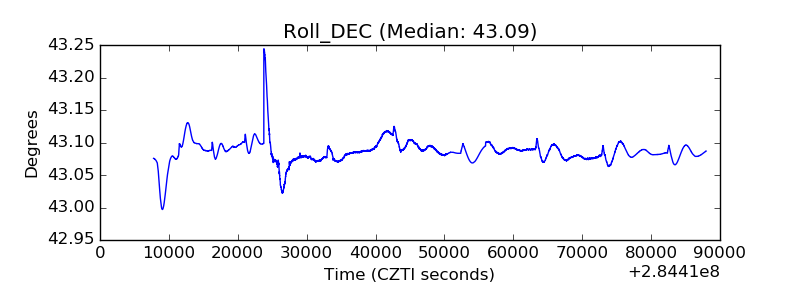 |
| _Roll_RA |  |
| Veto Counter |  |