| Param | Original file | Final file |
|---|---|---|
| Filename | modeM0/AS1A05_186T02_9000002624cztM0_level2_bc.evt | modeM0/AS1A05_186T02_9000002624cztM0_level2_quad_clean.evt |
| Size (bytes) | 1,631,295,360 | 555,462,720 |
| Size | 1.5 GB | 529.7 MB |
| Events in quadrant A | 9,384,269 | 3,510,549 |
| Events in quadrant B | 12,030,832 | 3,515,054 |
| Events in quadrant C | 10,099,043 | 3,370,878 |
| Events in quadrant D | 14,788,376 | 3,307,273 |
| Mode SS | |||
|---|---|---|---|
| Quadrant | BADHDUFLAG | Total packets | Discarded packets |
| A | 0 | 924 | 0 |
| B | 0 | 924 | 0 |
| C | 0 | 924 | 0 |
| D | 0 | 924 | 0 |
| Mode M9 | |||
|---|---|---|---|
| Quadrant | BADHDUFLAG | Total packets | Discarded packets |
| A | 0 | 54 | 0 |
| B | 0 | 54 | 0 |
| C | 0 | 54 | 0 |
| D | 0 | 54 | 0 |
| Mode M0 | |||
|---|---|---|---|
| Quadrant | BADHDUFLAG | Total packets | Discarded packets |
| A | 0 | 94278 | 0 |
| B | 0 | 103747 | 0 |
| C | 0 | 95022 | 0 |
| D | 0 | 112338 | 0 |
| Quadrant | Total seconds | Saturated seconds | Saturation percentage |
|---|---|---|---|
| A | 45456 | 767 | 1.687346% |
| B | 45456 | 1342 | 2.952306% |
| C | 45456 | 962 | 2.116332% |
| D | 45456 | 1739 | 3.825678% |
Noise dominated data is calculated using 1-second bins in cleaned event files. If a bin has >2000 counts, and if more than 50% of those come from <1% of pixels, then it is considered to be noise-dominated and hence unusable.
| Quadrant | # 1 sec bins | Bins with >0 counts | Bins with >2000 counts | High rate bins dominated by noise | Noise dominated (total time) | Noise dominated (detector-on time) | Marked lightcurve |
|---|---|---|---|---|---|---|---|
| A | 50866 | 45455 | 4 | 4 | 0.01% | 0.01% |  |
| B | 50866 | 45454 | 92 | 92 | 0.18% | 0.20% |  |
| C | 50866 | 45453 | 0 | 0 | 0.00% | 0.00% | 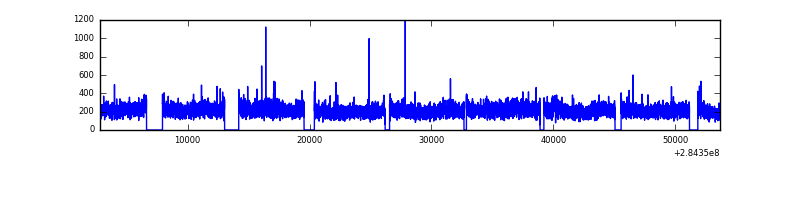 |
| D | 50866 | 45454 | 320 | 320 | 0.63% | 0.70% |  |
Top three noisy pixels from each quadrant. If the there are fewer than three noisy pixels in the level2.evt file, extra rows are filled as -1
| Pixel properties | Quadrant properties | ||||||
|---|---|---|---|---|---|---|---|
| Quadrant | DetID | PixID | Counts | Sigma | Mean | Median | Sigma |
| A | 14 | 237 | 278361 | 530.6 | 2345 | 2289 | 520.3 |
| A | 15 | 174 | 117518 | 221.46 | 2345 | 2289 | 520.3 |
| A | 12 | 194 | 15313 | 25.03 | 2345 | 2289 | 520.3 |
| B | 10 | 245 | 2084462 | 4702.54 | 2333 | 2270 | 442.8 |
| B | 0 | 189 | 256337 | 573.8 | 2333 | 2270 | 442.8 |
| B | 0 | 229 | 208246 | 465.19 | 2333 | 2270 | 442.8 |
| C | 3 | 233 | 1304619 | 2505.32 | 2231 | 2209 | 519.9 |
| C | 5 | 218 | 164413 | 312.02 | 2231 | 2209 | 519.9 |
| C | 5 | 219 | 19971 | 34.17 | 2231 | 2209 | 519.9 |
| D | 1 | 52 | 4426732 | 8364.23 | 2276 | 2194 | 529.0 |
| D | 7 | 238 | 911338 | 1718.66 | 2276 | 2194 | 529.0 |
| D | 2 | 234 | 183460 | 342.67 | 2276 | 2194 | 529.0 |
Histogram calculated using DETX and DETY for each event in the final _common_clean file
| Quadrant A | 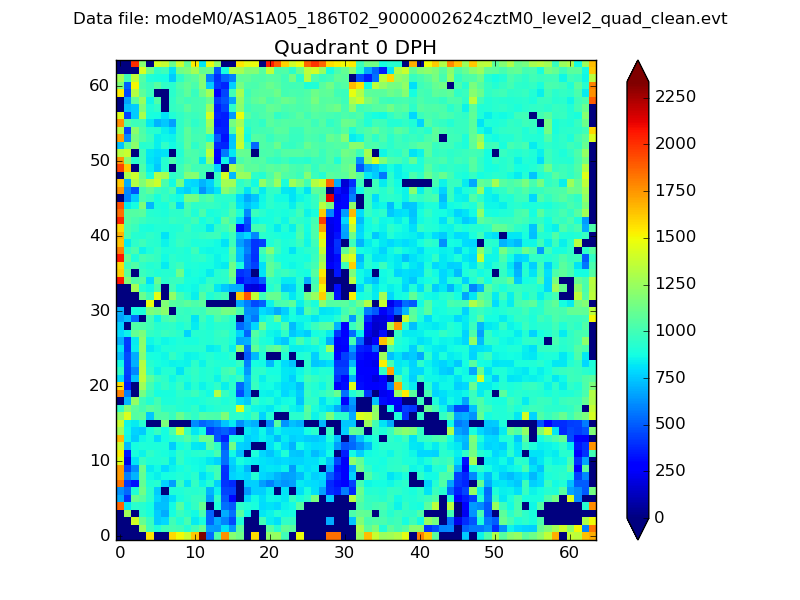 |
 |
Quadrant B |
|---|---|---|---|
| Quadrant D | 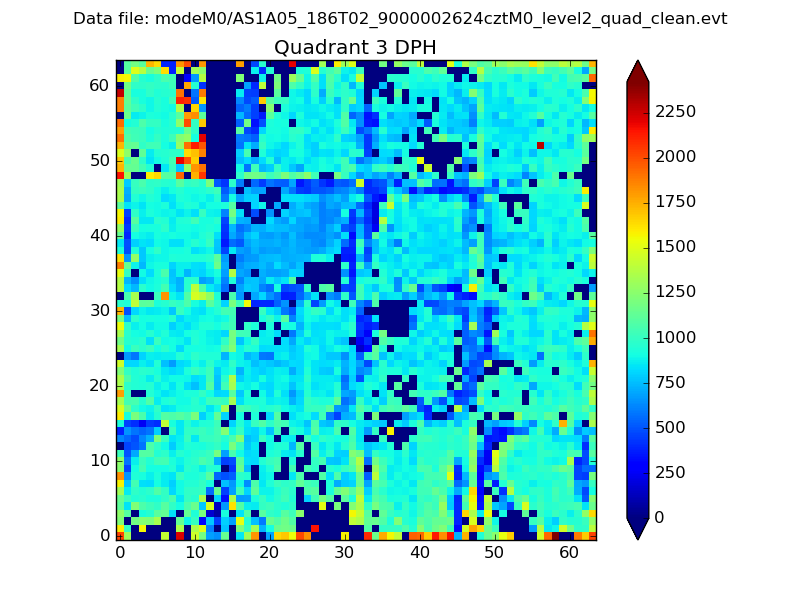 |
 |
Quadrant C |
| Plot type | Count rate plots | Images |
|---|---|---|
| Comparison with Poisson distribution Blue bars denote a histogram of data divided into 1 sec bins. Red curve is a Poisson curve with rate = median count rate of data. |
 |
 |
| Quadrant-wise count rates Data is divided into 100 sec bins |
 |
|
| Module-wise count rates for Quadrant A Data is divided into 100 sec bins |
 |
 |
| Module-wise count rates for Quadrant B Data is divided into 100 sec bins |
 |
 |
| Module-wise count rates for Quadrant C Data is divided into 100 sec bins |
 |
 |
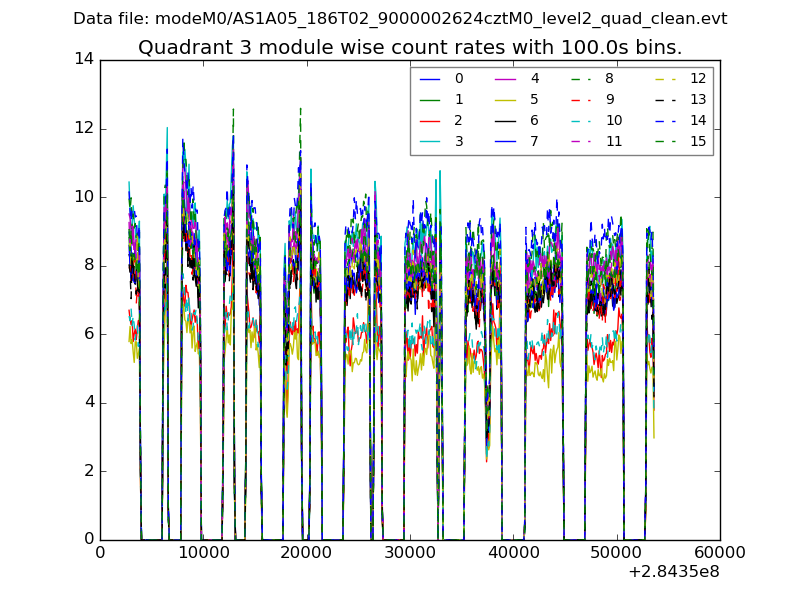
| Module-wise count rates for Quadrant D Data is divided into 100 sec bins |
 |
 |
| Parameter | Plot |
|---|---|
| CZT HV Monitor | 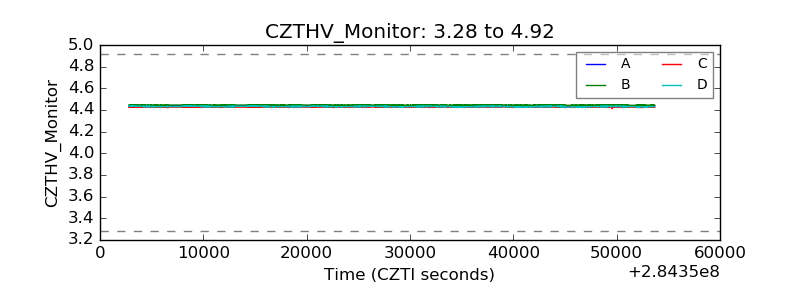 |
| D_VDD |  |
| Temperature 1 |  |
| Veto HV Monitor |  |
| Veto LLD |  |
| Alpha Counter | 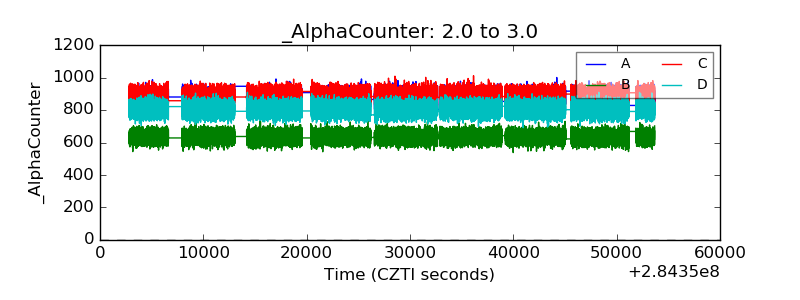 |
| _CPM_Rate |  |
| CZT Counter |  |
| +2.5 Volts monitor |  |
| +5 Volts monitor |  |
| _ROLL_ROT |  |
| _Roll_DEC |  |
| _Roll_RA | 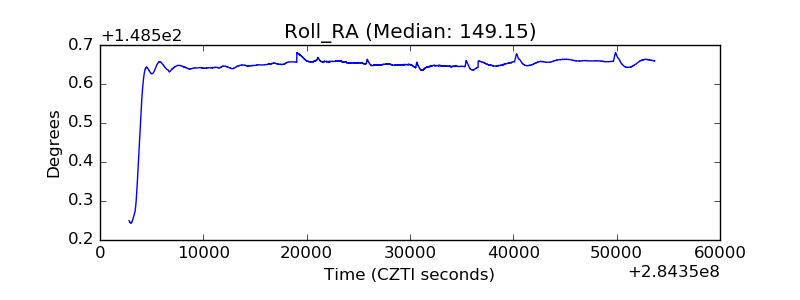 |
| Veto Counter |  |