| Param | Original file | Final file |
|---|---|---|
| Filename | modeM0/AS1T03_053T01_9000002616cztM0_level2_bc.evt | modeM0/AS1T03_053T01_9000002616cztM0_level2_quad_clean.evt |
| Size (bytes) | 214,577,280 | 107,190,720 |
| Size | 204.6 MB | 102.2 MB |
| Events in quadrant A | 1,372,038 | 699,824 |
| Events in quadrant B | 1,605,029 | 700,863 |
| Events in quadrant C | 1,490,786 | 677,450 |
| Events in quadrant D | 1,533,874 | 669,108 |
| Mode M0 | |||
|---|---|---|---|
| Quadrant | BADHDUFLAG | Total packets | Discarded packets |
| A | 0 | 14561 | 0 |
| B | 0 | 15403 | 0 |
| C | 0 | 15010 | 0 |
| D | 0 | 15064 | 0 |
| Mode M9 | |||
|---|---|---|---|
| Quadrant | BADHDUFLAG | Total packets | Discarded packets |
| A | 0 | 7 | 0 |
| B | 0 | 7 | 0 |
| C | 0 | 7 | 0 |
| D | 0 | 7 | 0 |
| Mode SS | |||
|---|---|---|---|
| Quadrant | BADHDUFLAG | Total packets | Discarded packets |
| A | 0 | 148 | 0 |
| B | 0 | 148 | 0 |
| C | 0 | 148 | 0 |
| D | 0 | 148 | 0 |
| Quadrant | Total seconds | Saturated seconds | Saturation percentage |
|---|---|---|---|
| A | 7168 | 78 | 1.088170% |
| B | 7168 | 93 | 1.297433% |
| C | 7168 | 120 | 1.674107% |
| D | 7168 | 97 | 1.353237% |
Noise dominated data is calculated using 1-second bins in cleaned event files. If a bin has >2000 counts, and if more than 50% of those come from <1% of pixels, then it is considered to be noise-dominated and hence unusable.
| Quadrant | # 1 sec bins | Bins with >0 counts | Bins with >2000 counts | High rate bins dominated by noise | Noise dominated (total time) | Noise dominated (detector-on time) | Marked lightcurve |
|---|---|---|---|---|---|---|---|
| A | 7757 | 7167 | 0 | 0 | 0.00% | 0.00% |  |
| B | 7758 | 7168 | 0 | 0 | 0.00% | 0.00% |  |
| C | 7758 | 7167 | 0 | 0 | 0.00% | 0.00% |  |
| D | 7758 | 7167 | 0 | 0 | 0.00% | 0.00% |  |
Top three noisy pixels from each quadrant. If the there are fewer than three noisy pixels in the level2.evt file, extra rows are filled as -1
| Pixel properties | Quadrant properties | ||||||
|---|---|---|---|---|---|---|---|
| Quadrant | DetID | PixID | Counts | Sigma | Mean | Median | Sigma |
| A | 15 | 174 | 5640 | 66.19 | 354 | 345 | 80.0 |
| A | 14 | 237 | 4174 | 47.86 | 354 | 345 | 80.0 |
| A | 3 | 1 | 3968 | 45.29 | 354 | 345 | 80.0 |
| B | 10 | 245 | 75076 | 1055.47 | 354 | 344 | 70.8 |
| B | 7 | 220 | 65149 | 915.26 | 354 | 344 | 70.8 |
| B | 0 | 219 | 16748 | 231.68 | 354 | 344 | 70.8 |
| C | 3 | 233 | 145611 | 1739.44 | 339 | 335 | 83.5 |
| C | 5 | 218 | 34612 | 410.41 | 339 | 335 | 83.5 |
| C | 1 | 16 | 2637 | 27.56 | 339 | 335 | 83.5 |
| D | 7 | 238 | 108226 | 1295.08 | 347 | 333 | 83.3 |
| D | 2 | 234 | 31540 | 374.59 | 347 | 333 | 83.3 |
| D | 10 | 70 | 28001 | 332.11 | 347 | 333 | 83.3 |
Histogram calculated using DETX and DETY for each event in the final _common_clean file
| Quadrant A |  |
 |
Quadrant B |
|---|---|---|---|
| Quadrant D |  |
 |
Quadrant C |
| Plot type | Count rate plots | Images |
|---|---|---|
| Comparison with Poisson distribution Blue bars denote a histogram of data divided into 1 sec bins. Red curve is a Poisson curve with rate = median count rate of data. |
 |
 |
| Quadrant-wise count rates Data is divided into 100 sec bins |
 |
|
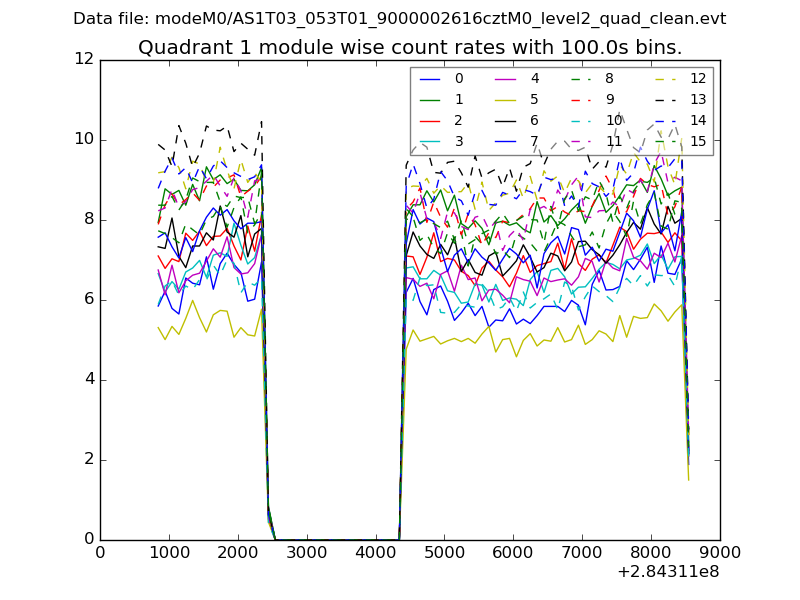
| Module-wise count rates for Quadrant A Data is divided into 100 sec bins |
 |
 |
| Module-wise count rates for Quadrant B Data is divided into 100 sec bins |
 |
 |
| Module-wise count rates for Quadrant C Data is divided into 100 sec bins |
 |
 |
| Module-wise count rates for Quadrant D Data is divided into 100 sec bins |
 |
 |
| Parameter | Plot |
|---|---|
| CZT HV Monitor |  |
| D_VDD |  |
| Temperature 1 |  |
| Veto HV Monitor |  |
| Veto LLD |  |
| Alpha Counter |  |
| _CPM_Rate |  |
| CZT Counter |  |
| +2.5 Volts monitor |  |
| +5 Volts monitor |  |
| _ROLL_ROT |  |
| _Roll_DEC |  |
| _Roll_RA |  |
| Veto Counter | 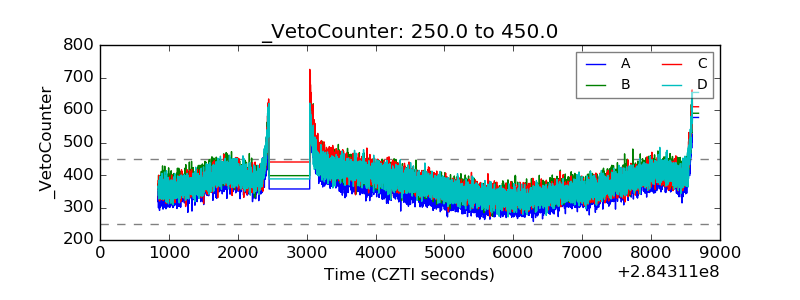 |