| Param | Original file | Final file |
|---|---|---|
| Filename | modeM0/AS1T03_052T01_9000002622cztM0_level2_bc.evt | modeM0/AS1T03_052T01_9000002622cztM0_level2_quad_clean.evt |
| Size (bytes) | 291,360,960 | 115,620,480 |
| Size | 277.9 MB | 110.3 MB |
| Events in quadrant A | 1,967,169 | 732,958 |
| Events in quadrant B | 2,099,543 | 759,777 |
| Events in quadrant C | 2,068,730 | 718,928 |
| Events in quadrant D | 2,096,643 | 694,768 |
| Mode SS | |||
|---|---|---|---|
| Quadrant | BADHDUFLAG | Total packets | Discarded packets |
| A | 0 | 174 | 0 |
| B | 0 | 174 | 0 |
| C | 0 | 174 | 0 |
| D | 0 | 174 | 0 |
| Mode M0 | |||
|---|---|---|---|
| Quadrant | BADHDUFLAG | Total packets | Discarded packets |
| A | 0 | 18179 | 0 |
| B | 0 | 18602 | 0 |
| C | 0 | 18570 | 0 |
| D | 0 | 18483 | 0 |
| Mode M9 | |||
|---|---|---|---|
| Quadrant | BADHDUFLAG | Total packets | Discarded packets |
| A | 0 | 27 | 0 |
| B | 0 | 27 | 0 |
| C | 0 | 27 | 0 |
| D | 0 | 27 | 0 |
| Quadrant | Total seconds | Saturated seconds | Saturation percentage |
|---|---|---|---|
| A | 8579 | 37 | 0.431286% |
| B | 8579 | 81 | 0.944166% |
| C | 8579 | 122 | 1.422077% |
| D | 8579 | 50 | 0.582819% |
Noise dominated data is calculated using 1-second bins in cleaned event files. If a bin has >2000 counts, and if more than 50% of those come from <1% of pixels, then it is considered to be noise-dominated and hence unusable.
| Quadrant | # 1 sec bins | Bins with >0 counts | Bins with >2000 counts | High rate bins dominated by noise | Noise dominated (total time) | Noise dominated (detector-on time) | Marked lightcurve |
|---|---|---|---|---|---|---|---|
| A | 11179 | 8581 | 1 | 1 | 0.01% | 0.01% | 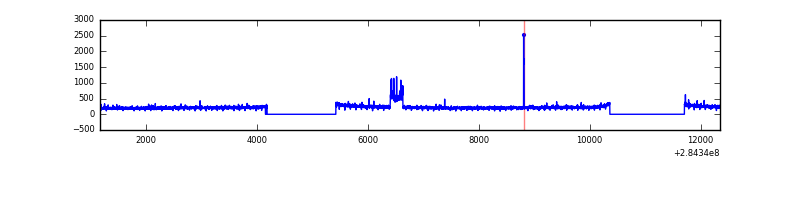 |
| B | 11179 | 8581 | 1 | 1 | 0.01% | 0.01% |  |
| C | 11179 | 8582 | 0 | 0 | 0.00% | 0.00% |  |
| D | 11179 | 8580 | 8 | 8 | 0.07% | 0.09% | 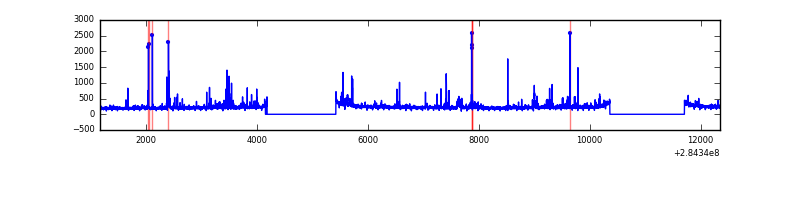 |
Top three noisy pixels from each quadrant. If the there are fewer than three noisy pixels in the level2.evt file, extra rows are filled as -1
| Pixel properties | Quadrant properties | ||||||
|---|---|---|---|---|---|---|---|
| Quadrant | DetID | PixID | Counts | Sigma | Mean | Median | Sigma |
| A | 15 | 31 | 88513 | 827.88 | 485 | 475 | 106.3 |
| A | 14 | 237 | 10963 | 98.63 | 485 | 475 | 106.3 |
| A | 5 | 98 | 10575 | 94.98 | 485 | 475 | 106.3 |
| B | 0 | 198 | 56912 | 603.3 | 494 | 484 | 93.5 |
| B | 10 | 245 | 55923 | 592.73 | 494 | 484 | 93.5 |
| B | 0 | 230 | 30971 | 325.95 | 494 | 484 | 93.5 |
| C | 3 | 233 | 261546 | 2388.31 | 467 | 464 | 109.3 |
| C | 5 | 218 | 10117 | 88.3 | 467 | 464 | 109.3 |
| C | 13 | 61 | 2737 | 20.79 | 467 | 464 | 109.3 |
| D | 1 | 52 | 69097 | 638.39 | 471 | 455 | 107.5 |
| D | 13 | 232 | 57639 | 531.83 | 471 | 455 | 107.5 |
| D | 2 | 152 | 43145 | 397.03 | 471 | 455 | 107.5 |
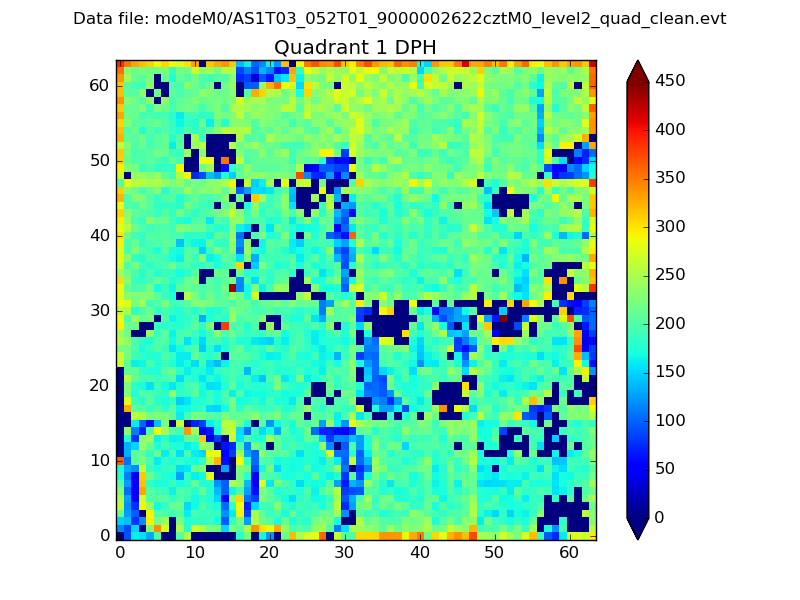
Histogram calculated using DETX and DETY for each event in the final _common_clean file
| Quadrant A |  |
 |
Quadrant B |
|---|---|---|---|
| Quadrant D |  |
 |
Quadrant C |
| Plot type | Count rate plots | Images |
|---|---|---|
| Comparison with Poisson distribution Blue bars denote a histogram of data divided into 1 sec bins. Red curve is a Poisson curve with rate = median count rate of data. |
 |
 |
| Quadrant-wise count rates Data is divided into 100 sec bins |
 |
|
| Module-wise count rates for Quadrant A Data is divided into 100 sec bins |
 |
 |
| Module-wise count rates for Quadrant B Data is divided into 100 sec bins |
 |
 |
| Module-wise count rates for Quadrant C Data is divided into 100 sec bins |
 |
 |
| Module-wise count rates for Quadrant D Data is divided into 100 sec bins |
 |
 |
| Parameter | Plot |
|---|---|
| CZT HV Monitor |  |
| D_VDD |  |
| Temperature 1 |  |
| Veto HV Monitor |  |
| Veto LLD |  |
| Alpha Counter |  |
| _CPM_Rate |  |
| CZT Counter |  |
| +2.5 Volts monitor |  |
| +5 Volts monitor |  |
| _ROLL_ROT |  |
| _Roll_DEC |  |
| _Roll_RA |  |
| Veto Counter | 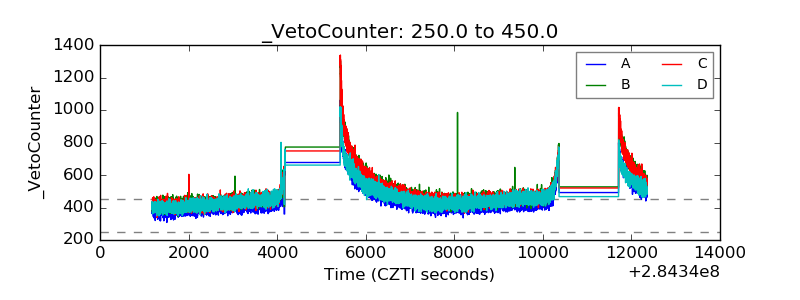 |