| Param | Original file | Final file |
|---|---|---|
| Filename | modeM0/AS1T03_050T01_9000002620cztM0_level2_bc.evt | modeM0/AS1T03_050T01_9000002620cztM0_level2_quad_clean.evt |
| Size (bytes) | 226,275,840 | 91,938,240 |
| Size | 215.8 MB | 87.7 MB |
| Events in quadrant A | 1,362,915 | 600,704 |
| Events in quadrant B | 1,983,442 | 600,858 |
| Events in quadrant C | 1,591,060 | 586,752 |
| Events in quadrant D | 1,493,740 | 571,481 |
| Mode M9 | |||
|---|---|---|---|
| Quadrant | BADHDUFLAG | Total packets | Discarded packets |
| A | 0 | 12 | 0 |
| B | 0 | 12 | 0 |
| C | 0 | 12 | 0 |
| D | 0 | 12 | 0 |
| Mode SS | |||
|---|---|---|---|
| Quadrant | BADHDUFLAG | Total packets | Discarded packets |
| A | 0 | 124 | 0 |
| B | 0 | 124 | 0 |
| C | 0 | 124 | 0 |
| D | 0 | 124 | 0 |
| Mode M0 | |||
|---|---|---|---|
| Quadrant | BADHDUFLAG | Total packets | Discarded packets |
| A | 0 | 12776 | 0 |
| B | 0 | 15017 | 0 |
| C | 0 | 14053 | 0 |
| D | 0 | 12934 | 0 |
| Quadrant | Total seconds | Saturated seconds | Saturation percentage |
|---|---|---|---|
| A | 6077 | 36 | 0.592398% |
| B | 6077 | 263 | 4.327793% |
| C | 6077 | 64 | 1.053151% |
| D | 6077 | 29 | 0.477209% |
Noise dominated data is calculated using 1-second bins in cleaned event files. If a bin has >2000 counts, and if more than 50% of those come from <1% of pixels, then it is considered to be noise-dominated and hence unusable.
| Quadrant | # 1 sec bins | Bins with >0 counts | Bins with >2000 counts | High rate bins dominated by noise | Noise dominated (total time) | Noise dominated (detector-on time) | Marked lightcurve |
|---|---|---|---|---|---|---|---|
| A | 7242 | 6078 | 0 | 0 | 0.00% | 0.00% |  |
| B | 7242 | 6077 | 82 | 82 | 1.13% | 1.35% |  |
| C | 7242 | 6077 | 0 | 0 | 0.00% | 0.00% |  |
| D | 7242 | 6077 | 4 | 4 | 0.06% | 0.07% |  |
Top three noisy pixels from each quadrant. If the there are fewer than three noisy pixels in the level2.evt file, extra rows are filled as -1
| Pixel properties | Quadrant properties | ||||||
|---|---|---|---|---|---|---|---|
| Quadrant | DetID | PixID | Counts | Sigma | Mean | Median | Sigma |
| A | 14 | 237 | 102458 | 1389.2 | 328 | 320 | 73.5 |
| A | 0 | 226 | 2175 | 25.23 | 328 | 320 | 73.5 |
| A | 12 | 194 | 2101 | 24.22 | 328 | 320 | 73.5 |
| B | 10 | 245 | 635577 | 9820.31 | 330 | 323 | 64.7 |
| B | 0 | 229 | 22164 | 337.64 | 330 | 323 | 64.7 |
| B | 0 | 189 | 13362 | 201.57 | 330 | 323 | 64.7 |
| C | 3 | 233 | 347522 | 4512.37 | 320 | 318 | 76.9 |
| C | 5 | 218 | 9573 | 120.28 | 320 | 318 | 76.9 |
| C | 13 | 61 | 1913 | 20.73 | 320 | 318 | 76.9 |
| D | 1 | 52 | 146380 | 1892.99 | 324 | 311 | 77.2 |
| D | 7 | 38 | 28228 | 361.79 | 324 | 311 | 77.2 |
| D | 2 | 234 | 24423 | 312.48 | 324 | 311 | 77.2 |
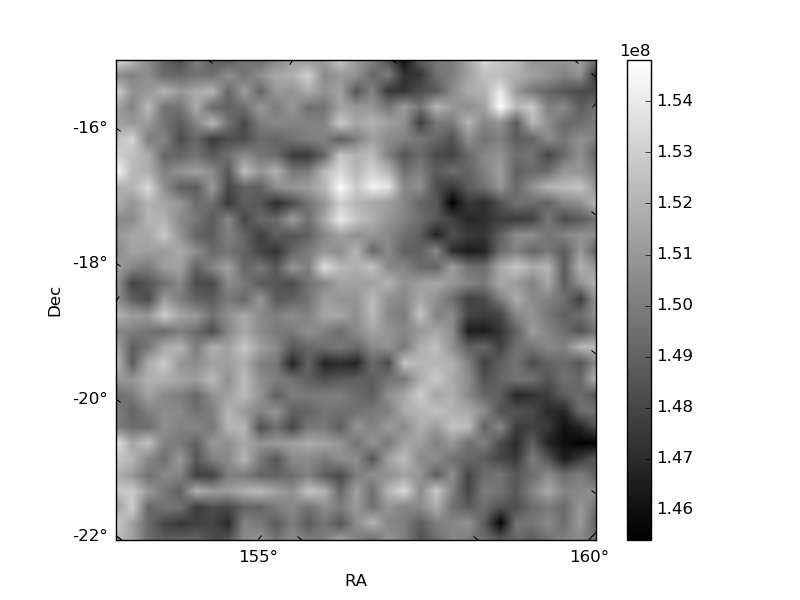
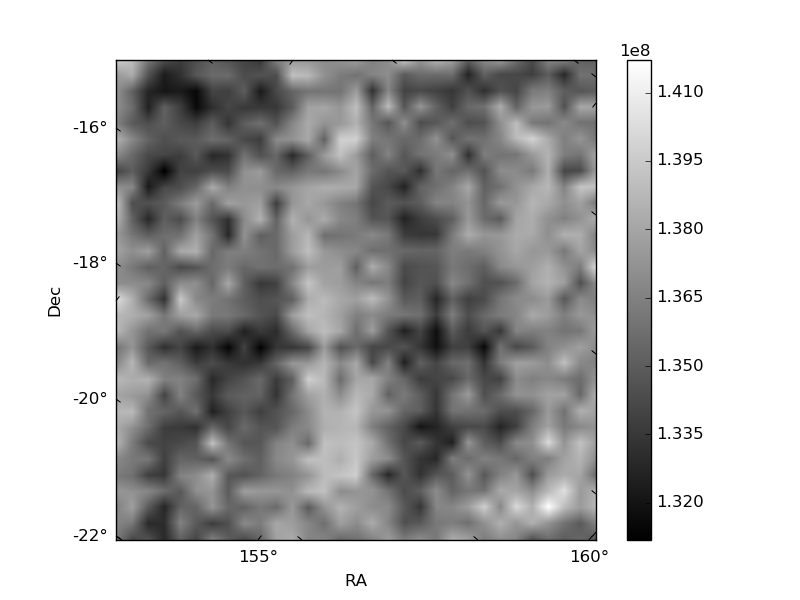
Histogram calculated using DETX and DETY for each event in the final _common_clean file
| Quadrant A |  |
 |
Quadrant B |
|---|---|---|---|
| Quadrant D |  |
 |
Quadrant C |
| Plot type | Count rate plots | Images |
|---|---|---|
| Comparison with Poisson distribution Blue bars denote a histogram of data divided into 1 sec bins. Red curve is a Poisson curve with rate = median count rate of data. |
 |
 |
| Quadrant-wise count rates Data is divided into 100 sec bins |
 |
|
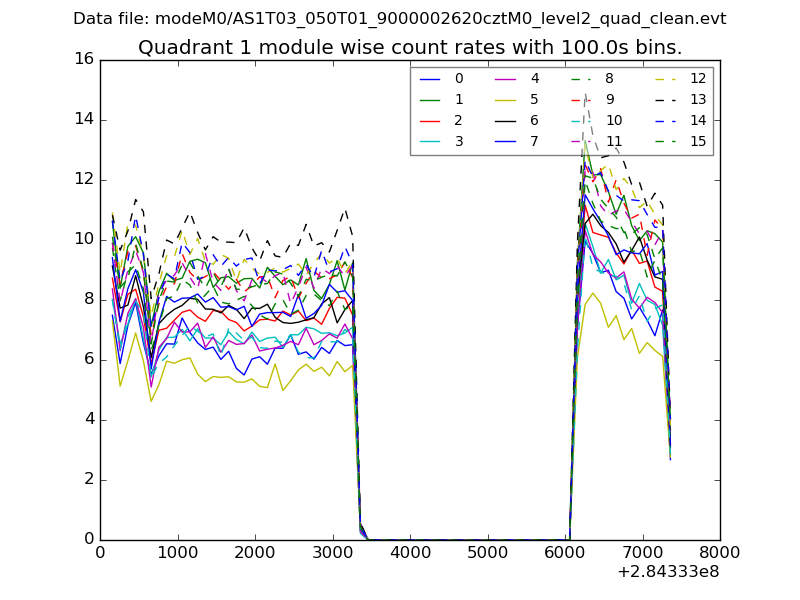
| Module-wise count rates for Quadrant A Data is divided into 100 sec bins |
 |
 |
| Module-wise count rates for Quadrant B Data is divided into 100 sec bins |
 |
 |
| Module-wise count rates for Quadrant C Data is divided into 100 sec bins |
 |
 |
| Module-wise count rates for Quadrant D Data is divided into 100 sec bins |
 |
 |
| Parameter | Plot |
|---|---|
| CZT HV Monitor |  |
| D_VDD |  |
| Temperature 1 |  |
| Veto HV Monitor | 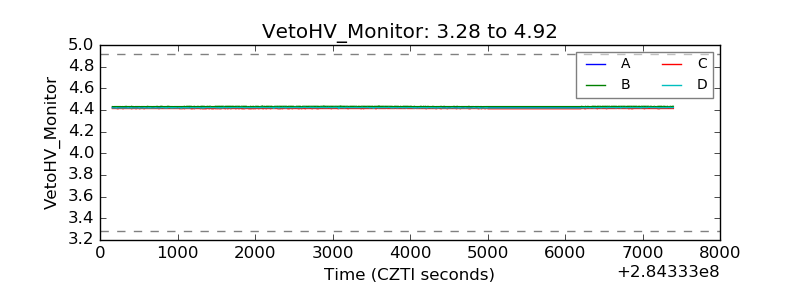 |
| Veto LLD | 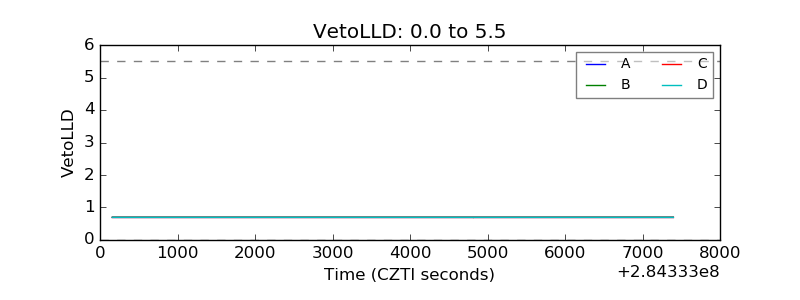 |
| Alpha Counter |  |
| _CPM_Rate |  |
| CZT Counter |  |
| +2.5 Volts monitor | 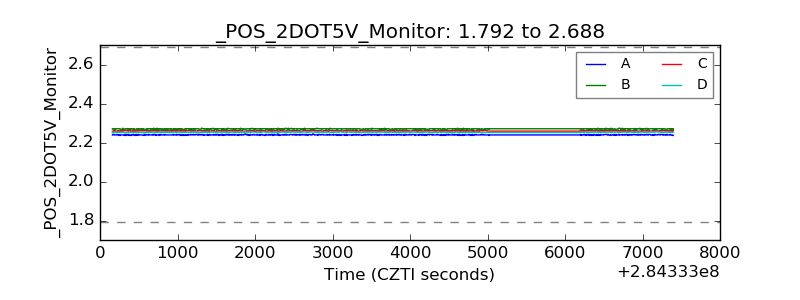 |
| +5 Volts monitor |  |
| _ROLL_ROT |  |
| _Roll_DEC |  |
| _Roll_RA |  |
| Veto Counter |  |