| Param | Original file | Final file |
|---|---|---|
| Filename | modeM0/AS1C04_009T02_9000002618cztM0_level2_bc.evt | modeM0/AS1C04_009T02_9000002618cztM0_level2_quad_clean.evt |
| Size (bytes) | 326,712,960 | 193,950,720 |
| Size | 311.6 MB | 185.0 MB |
| Events in quadrant A | 2,008,638 | 1,307,802 |
| Events in quadrant B | 2,579,085 | 1,318,865 |
| Events in quadrant C | 2,125,494 | 1,266,232 |
| Events in quadrant D | 2,453,977 | 1,250,861 |
| Mode SS | |||
|---|---|---|---|
| Quadrant | BADHDUFLAG | Total packets | Discarded packets |
| A | 0 | 216 | 0 |
| B | 0 | 216 | 0 |
| C | 0 | 216 | 0 |
| D | 0 | 216 | 0 |
| Mode M0 | |||
|---|---|---|---|
| Quadrant | BADHDUFLAG | Total packets | Discarded packets |
| A | 0 | 21362 | 0 |
| B | 0 | 23514 | 0 |
| C | 0 | 21711 | 0 |
| D | 0 | 22750 | 0 |
| Mode M9 | |||
|---|---|---|---|
| Quadrant | BADHDUFLAG | Total packets | Discarded packets |
| A | 0 | 10 | 0 |
| B | 0 | 10 | 0 |
| C | 0 | 10 | 0 |
| D | 0 | 10 | 0 |
| Quadrant | Total seconds | Saturated seconds | Saturation percentage |
|---|---|---|---|
| A | 10556 | 21 | 0.198939% |
| B | 10553 | 81 | 0.767554% |
| C | 10556 | 92 | 0.871542% |
| D | 10556 | 79 | 0.748390% |
Noise dominated data is calculated using 1-second bins in cleaned event files. If a bin has >2000 counts, and if more than 50% of those come from <1% of pixels, then it is considered to be noise-dominated and hence unusable.
| Quadrant | # 1 sec bins | Bins with >0 counts | Bins with >2000 counts | High rate bins dominated by noise | Noise dominated (total time) | Noise dominated (detector-on time) | Marked lightcurve |
|---|---|---|---|---|---|---|---|
| A | 11496 | 10556 | 0 | 0 | 0.00% | 0.00% |  |
| B | 11496 | 10556 | 2 | 2 | 0.02% | 0.02% |  |
| C | 11496 | 10556 | 0 | 0 | 0.00% | 0.00% |  |
| D | 11496 | 10556 | 5 | 5 | 0.04% | 0.05% |  |
Top three noisy pixels from each quadrant. If the there are fewer than three noisy pixels in the level2.evt file, extra rows are filled as -1
| Pixel properties | Quadrant properties | ||||||
|---|---|---|---|---|---|---|---|
| Quadrant | DetID | PixID | Counts | Sigma | Mean | Median | Sigma |
| A | 12 | 194 | 3482 | 25.3 | 522 | 512 | 117.4 |
| A | 0 | 226 | 3379 | 24.42 | 522 | 512 | 117.4 |
| A | 13 | 254 | 2636 | 18.09 | 522 | 512 | 117.4 |
| B | 10 | 245 | 174962 | 1668.07 | 527 | 513 | 104.6 |
| B | 0 | 189 | 100831 | 959.23 | 527 | 513 | 104.6 |
| B | 7 | 220 | 93867 | 892.64 | 527 | 513 | 104.6 |
| C | 3 | 233 | 152732 | 1266.88 | 503 | 500 | 120.2 |
| C | 5 | 218 | 35879 | 294.43 | 503 | 500 | 120.2 |
| C | 13 | 61 | 2930 | 20.22 | 503 | 500 | 120.2 |
| D | 1 | 52 | 144850 | 1167.67 | 515 | 495 | 123.6 |
| D | 12 | 233 | 74027 | 594.79 | 515 | 495 | 123.6 |
| D | 7 | 238 | 73720 | 592.31 | 515 | 495 | 123.6 |
Histogram calculated using DETX and DETY for each event in the final _common_clean file
| Quadrant A | 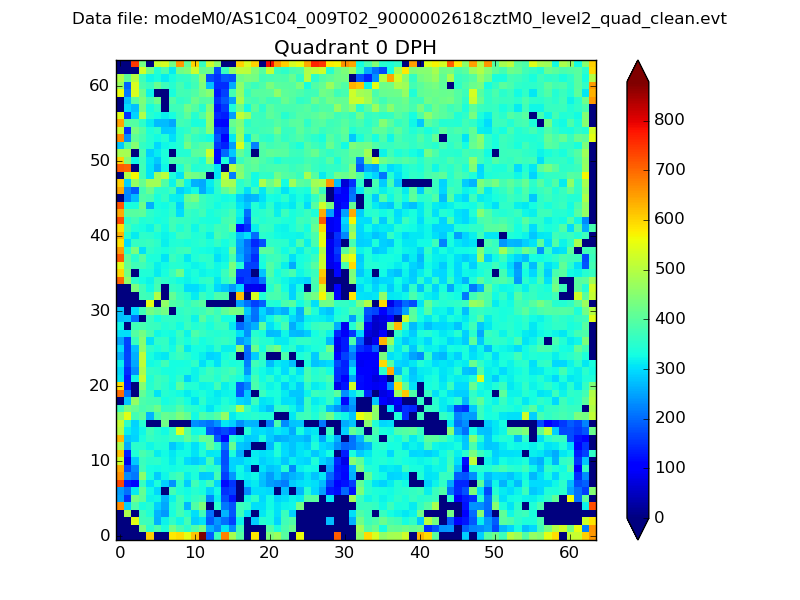 |
 |
Quadrant B |
|---|---|---|---|
| Quadrant D |  |
 |
Quadrant C |
| Plot type | Count rate plots | Images |
|---|---|---|
| Comparison with Poisson distribution Blue bars denote a histogram of data divided into 1 sec bins. Red curve is a Poisson curve with rate = median count rate of data. |
 |
 |
| Quadrant-wise count rates Data is divided into 100 sec bins |
 |
|
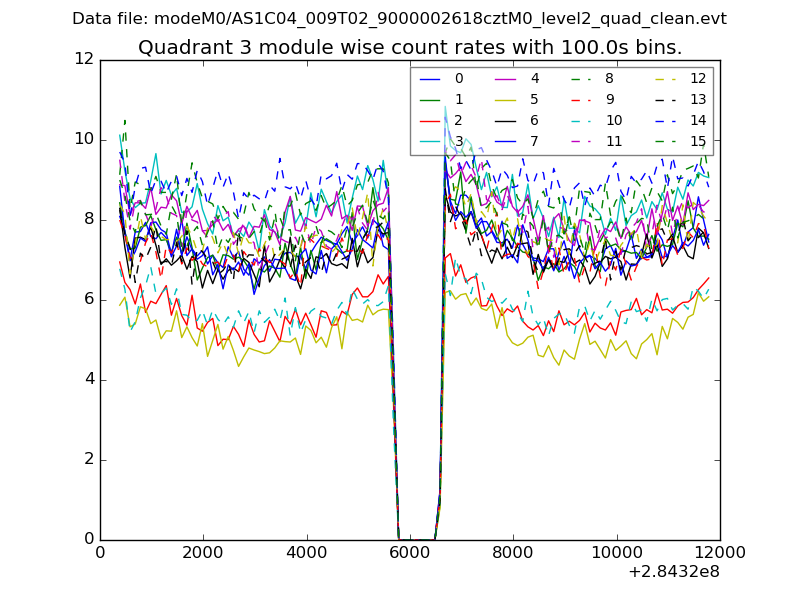
| Module-wise count rates for Quadrant A Data is divided into 100 sec bins |
 |
 |
| Module-wise count rates for Quadrant B Data is divided into 100 sec bins |
 |
 |
| Module-wise count rates for Quadrant C Data is divided into 100 sec bins |
 |
 |
| Module-wise count rates for Quadrant D Data is divided into 100 sec bins |
 |
 |
| Parameter | Plot |
|---|---|
| CZT HV Monitor |  |
| D_VDD |  |
| Temperature 1 |  |
| Veto HV Monitor |  |
| Veto LLD | 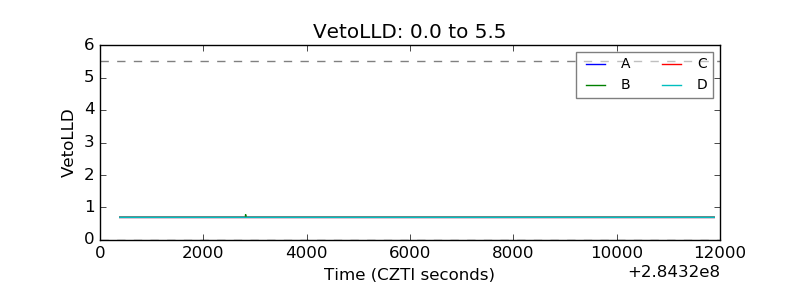 |
| Alpha Counter |  |
| _CPM_Rate |  |
| CZT Counter |  |
| +2.5 Volts monitor |  |
| +5 Volts monitor |  |
| _ROLL_ROT |  |
| _Roll_DEC | 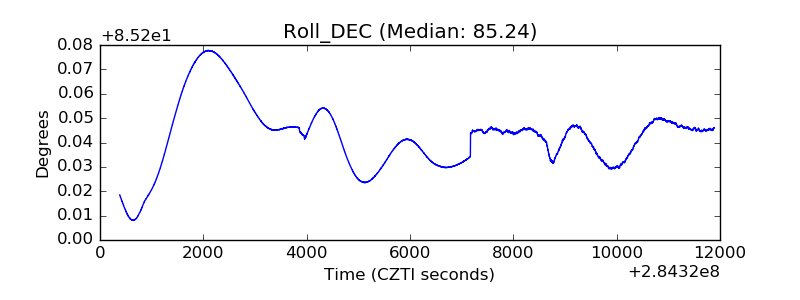 |
| _Roll_RA |  |
| Veto Counter | 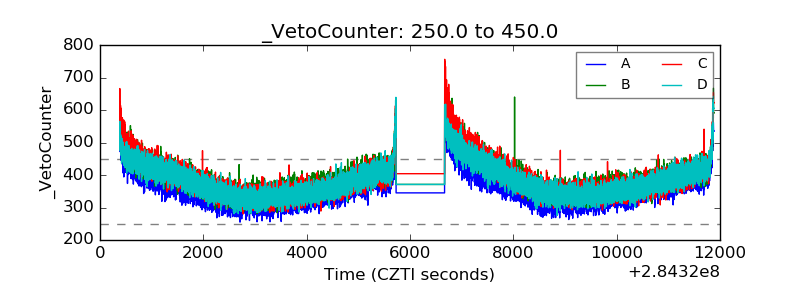 |