| Param | Original file | Final file |
|---|---|---|
| Filename | modeM0/AS1A05_208T01_9000002614cztM0_level2_bc.evt | modeM0/AS1A05_208T01_9000002614cztM0_level2_quad_clean.evt |
| Size (bytes) | 3,021,145,920 | 1,115,922,240 |
| Size | 2.8 GB | 1.0 GB |
| Events in quadrant A | 18,849,058 | 7,003,678 |
| Events in quadrant B | 20,191,278 | 7,141,532 |
| Events in quadrant C | 23,682,376 | 6,826,731 |
| Events in quadrant D | 22,713,064 | 6,733,263 |
| Mode M9 | |||
|---|---|---|---|
| Quadrant | BADHDUFLAG | Total packets | Discarded packets |
| A | 0 | 123 | 0 |
| B | 0 | 124 | 0 |
| C | 0 | 124 | 0 |
| D | 0 | 124 | 0 |
| Mode M0 | |||
|---|---|---|---|
| Quadrant | BADHDUFLAG | Total packets | Discarded packets |
| A | 0 | 186041 | 0 |
| B | 0 | 191876 | 0 |
| C | 0 | 207501 | 0 |
| D | 0 | 199877 | 0 |
| Mode SS | |||
|---|---|---|---|
| Quadrant | BADHDUFLAG | Total packets | Discarded packets |
| A | 0 | 1814 | 0 |
| B | 0 | 1814 | 0 |
| C | 0 | 1814 | 0 |
| D | 0 | 1814 | 0 |
| Quadrant | Total seconds | Saturated seconds | Saturation percentage |
|---|---|---|---|
| A | 88894 | 1361 | 1.531037% |
| B | 88893 | 1811 | 2.037281% |
| C | 88893 | 2031 | 2.284769% |
| D | 88894 | 2025 | 2.277994% |
Noise dominated data is calculated using 1-second bins in cleaned event files. If a bin has >2000 counts, and if more than 50% of those come from <1% of pixels, then it is considered to be noise-dominated and hence unusable.
| Quadrant | # 1 sec bins | Bins with >0 counts | Bins with >2000 counts | High rate bins dominated by noise | Noise dominated (total time) | Noise dominated (detector-on time) | Marked lightcurve |
|---|---|---|---|---|---|---|---|
| A | 110913 | 88896 | 0 | 0 | 0.00% | 0.00% |  |
| B | 110913 | 88892 | 23 | 23 | 0.02% | 0.03% | 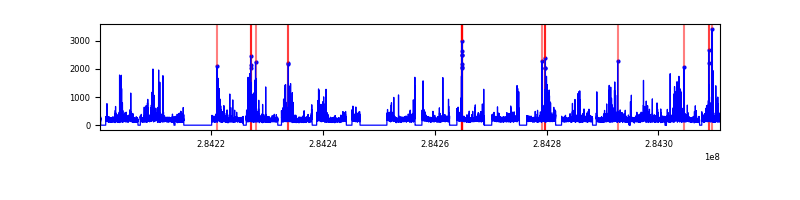 |
| C | 110913 | 88894 | 0 | 0 | 0.00% | 0.00% |  |
| D | 110913 | 88892 | 191 | 191 | 0.17% | 0.21% |  |
Top three noisy pixels from each quadrant. If the there are fewer than three noisy pixels in the level2.evt file, extra rows are filled as -1
| Pixel properties | Quadrant properties | ||||||
|---|---|---|---|---|---|---|---|
| Quadrant | DetID | PixID | Counts | Sigma | Mean | Median | Sigma |
| A | 14 | 237 | 1040483 | 1027.92 | 4589 | 4486 | 1007.9 |
| A | 8 | 205 | 142693 | 137.13 | 4589 | 4486 | 1007.9 |
| A | 4 | 2 | 37106 | 32.37 | 4589 | 4486 | 1007.9 |
| B | 10 | 245 | 659175 | 752.89 | 4630 | 4507 | 869.5 |
| B | 7 | 220 | 491955 | 560.58 | 4630 | 4507 | 869.5 |
| B | 0 | 189 | 229917 | 259.23 | 4630 | 4507 | 869.5 |
| C | 3 | 233 | 6357024 | 6156.13 | 4436 | 4415 | 1031.9 |
| C | 5 | 218 | 187413 | 177.34 | 4436 | 4415 | 1031.9 |
| C | 9 | 54 | 37668 | 32.22 | 4436 | 4415 | 1031.9 |
| D | 1 | 52 | 1532815 | 1472.76 | 4523 | 4358 | 1037.8 |
| D | 5 | 222 | 1393150 | 1338.19 | 4523 | 4358 | 1037.8 |
| D | 7 | 238 | 902994 | 865.89 | 4523 | 4358 | 1037.8 |
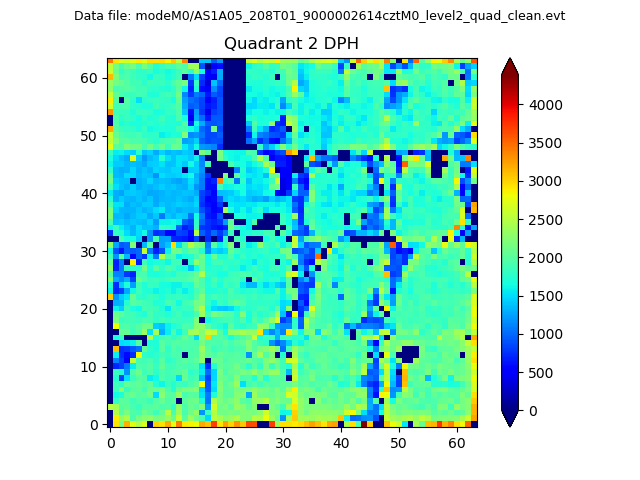
Histogram calculated using DETX and DETY for each event in the final _common_clean file
| Quadrant A |  |
 |
Quadrant B |
|---|---|---|---|
| Quadrant D |  |
 |
Quadrant C |
| Plot type | Count rate plots | Images |
|---|---|---|
| Comparison with Poisson distribution Blue bars denote a histogram of data divided into 1 sec bins. Red curve is a Poisson curve with rate = median count rate of data. |
 |
 |
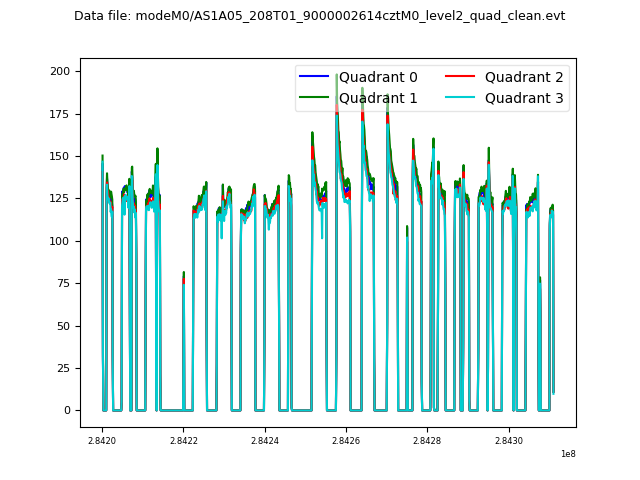
| Quadrant-wise count rates Data is divided into 100 sec bins |
 |
|
| Module-wise count rates for Quadrant A Data is divided into 100 sec bins |
 |
 |
| Module-wise count rates for Quadrant B Data is divided into 100 sec bins |
 |
 |
| Module-wise count rates for Quadrant C Data is divided into 100 sec bins |
 |
 |
| Module-wise count rates for Quadrant D Data is divided into 100 sec bins |
 |
 |
| Parameter | Plot |
|---|---|
| CZT HV Monitor |  |
| D_VDD |  |
| Temperature 1 |  |
| Veto HV Monitor |  |
| Veto LLD |  |
| Alpha Counter |  |
| _CPM_Rate |  |
| CZT Counter |  |
| +2.5 Volts monitor |  |
| +5 Volts monitor |  |
| _ROLL_ROT |  |
| _Roll_DEC | 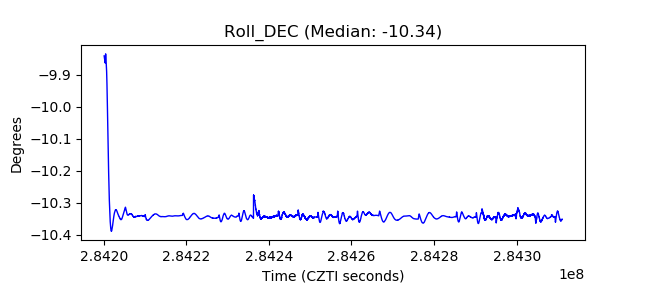 |
| _Roll_RA |  |
| Veto Counter |  |