| Param | Original file | Final file |
|---|---|---|
| Filename | modeM0/AS1T03_071T01_9000002610cztM0_level2_bc.evt | modeM0/AS1T03_071T01_9000002610cztM0_level2_quad_clean.evt |
| Size (bytes) | 2,369,859,840 | 823,308,480 |
| Size | 2.2 GB | 785.2 MB |
| Events in quadrant A | 14,269,647 | 5,250,464 |
| Events in quadrant B | 13,692,471 | 5,280,427 |
| Events in quadrant C | 17,112,911 | 5,017,368 |
| Events in quadrant D | 22,292,183 | 4,956,349 |
| Mode SS | |||
|---|---|---|---|
| Quadrant | BADHDUFLAG | Total packets | Discarded packets |
| A | 0 | 1318 | 0 |
| B | 0 | 1318 | 0 |
| C | 0 | 1318 | 0 |
| D | 0 | 1318 | 0 |
| Mode M0 | |||
|---|---|---|---|
| Quadrant | BADHDUFLAG | Total packets | Discarded packets |
| A | 0 | 136896 | 0 |
| B | 0 | 134475 | 0 |
| C | 0 | 146495 | 0 |
| D | 0 | 163264 | 0 |
| Mode M9 | |||
|---|---|---|---|
| Quadrant | BADHDUFLAG | Total packets | Discarded packets |
| A | 0 | 102 | 0 |
| B | 0 | 102 | 0 |
| C | 0 | 102 | 0 |
| D | 0 | 102 | 0 |
| Quadrant | Total seconds | Saturated seconds | Saturation percentage |
|---|---|---|---|
| A | 64645 | 688 | 1.064274% |
| B | 64645 | 675 | 1.044164% |
| C | 64645 | 1067 | 1.650553% |
| D | 64645 | 1596 | 2.468868% |
Noise dominated data is calculated using 1-second bins in cleaned event files. If a bin has >2000 counts, and if more than 50% of those come from <1% of pixels, then it is considered to be noise-dominated and hence unusable.
| Quadrant | # 1 sec bins | Bins with >0 counts | Bins with >2000 counts | High rate bins dominated by noise | Noise dominated (total time) | Noise dominated (detector-on time) | Marked lightcurve |
|---|---|---|---|---|---|---|---|
| A | 74780 | 64645 | 6 | 6 | 0.01% | 0.01% |  |
| B | 74780 | 64640 | 3 | 3 | 0.00% | 0.00% | 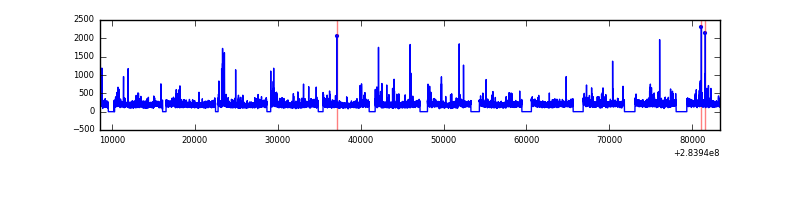 |
| C | 74780 | 64644 | 8 | 8 | 0.01% | 0.01% |  |
| D | 74780 | 64645 | 73 | 73 | 0.10% | 0.11% |  |
Top three noisy pixels from each quadrant. If the there are fewer than three noisy pixels in the level2.evt file, extra rows are filled as -1
| Pixel properties | Quadrant properties | ||||||
|---|---|---|---|---|---|---|---|
| Quadrant | DetID | PixID | Counts | Sigma | Mean | Median | Sigma |
| A | 14 | 237 | 1209345 | 1639.82 | 3398 | 3337 | 735.5 |
| A | 15 | 191 | 26139 | 31.0 | 3398 | 3337 | 735.5 |
| A | 0 | 226 | 22467 | 26.01 | 3398 | 3337 | 735.5 |
| B | 0 | 230 | 138484 | 211.43 | 3400 | 3315 | 639.3 |
| B | 0 | 189 | 108931 | 165.21 | 3400 | 3315 | 639.3 |
| B | 4 | 80 | 93561 | 141.16 | 3400 | 3315 | 639.3 |
| C | 3 | 233 | 3954279 | 5283.26 | 3212 | 3189 | 747.9 |
| C | 0 | 207 | 390776 | 518.27 | 3212 | 3189 | 747.9 |
| C | 5 | 218 | 326592 | 432.44 | 3212 | 3189 | 747.9 |
| D | 12 | 144 | 4483999 | 5866.91 | 3299 | 3184 | 763.7 |
| D | 1 | 52 | 3378983 | 4420.07 | 3299 | 3184 | 763.7 |
| D | 13 | 189 | 739726 | 964.38 | 3299 | 3184 | 763.7 |
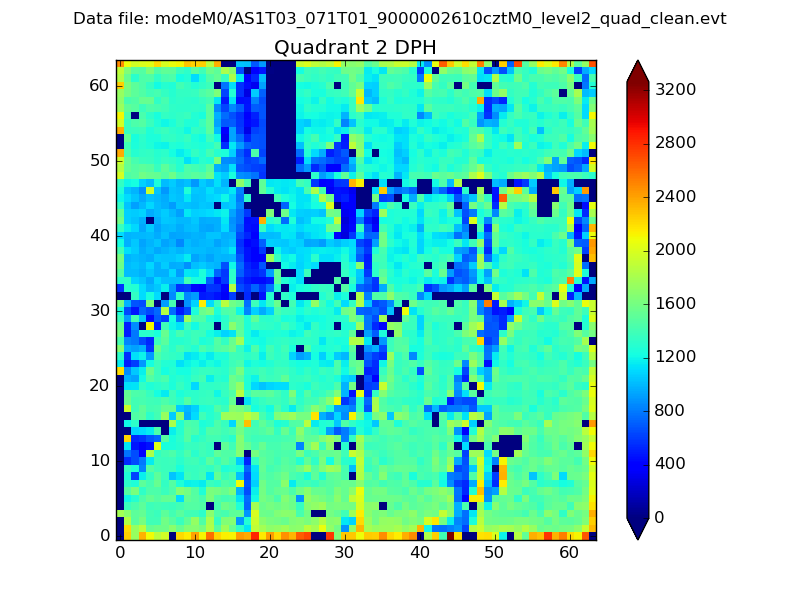
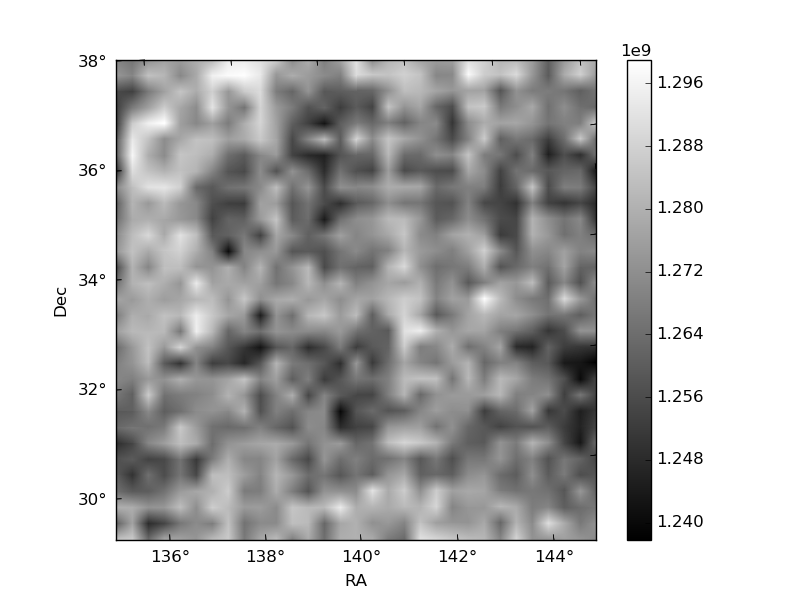
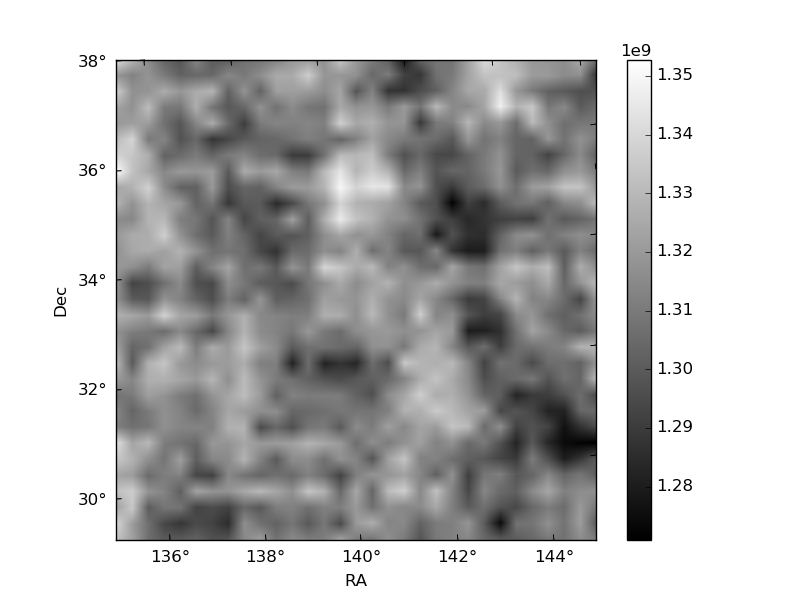
Histogram calculated using DETX and DETY for each event in the final _common_clean file
| Quadrant A |  |
 |
Quadrant B |
|---|---|---|---|
| Quadrant D | 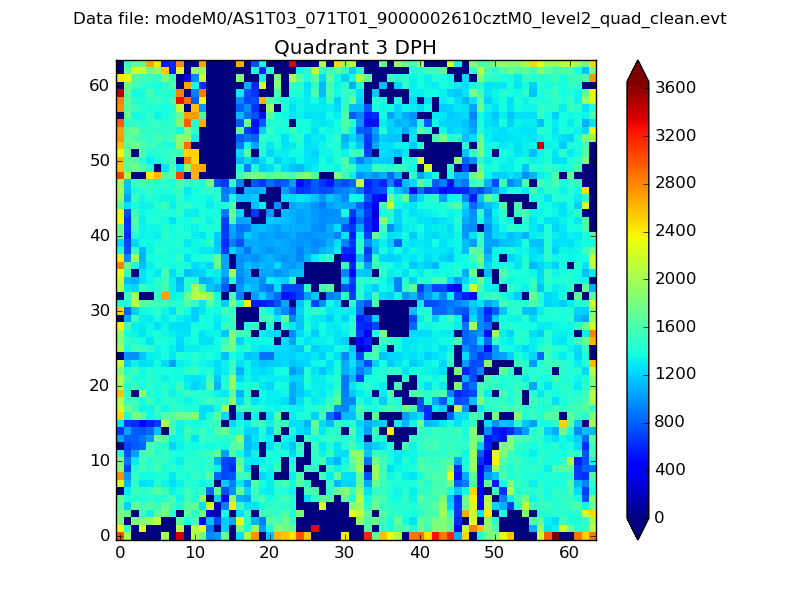 |
 |
Quadrant C |
| Plot type | Count rate plots | Images |
|---|---|---|
| Comparison with Poisson distribution Blue bars denote a histogram of data divided into 1 sec bins. Red curve is a Poisson curve with rate = median count rate of data. |
 |
 |
| Quadrant-wise count rates Data is divided into 100 sec bins |
 |
|
| Module-wise count rates for Quadrant A Data is divided into 100 sec bins |
 |
 |
| Module-wise count rates for Quadrant B Data is divided into 100 sec bins |
 |
 |
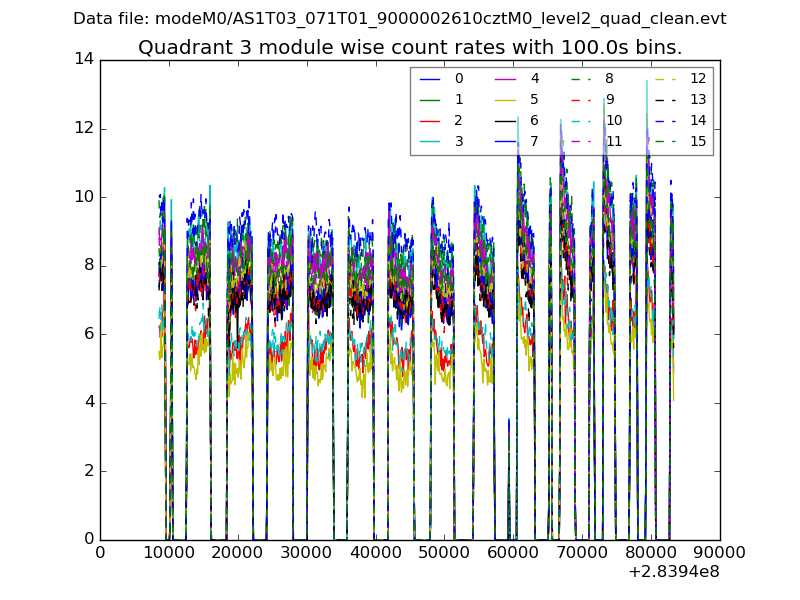
| Module-wise count rates for Quadrant C Data is divided into 100 sec bins |
 |
 |
| Module-wise count rates for Quadrant D Data is divided into 100 sec bins |
 |
 |
| Parameter | Plot |
|---|---|
| CZT HV Monitor |  |
| D_VDD |  |
| Temperature 1 |  |
| Veto HV Monitor |  |
| Veto LLD | 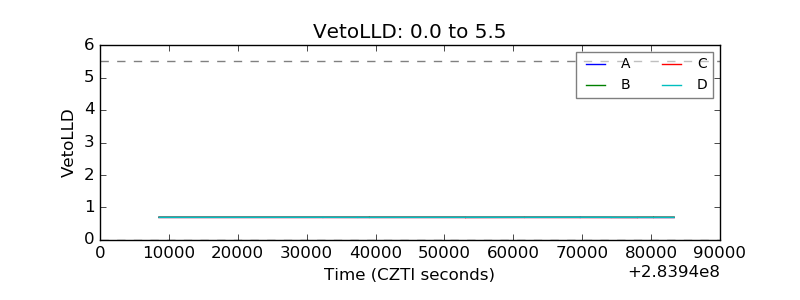 |
| Alpha Counter |  |
| _CPM_Rate | 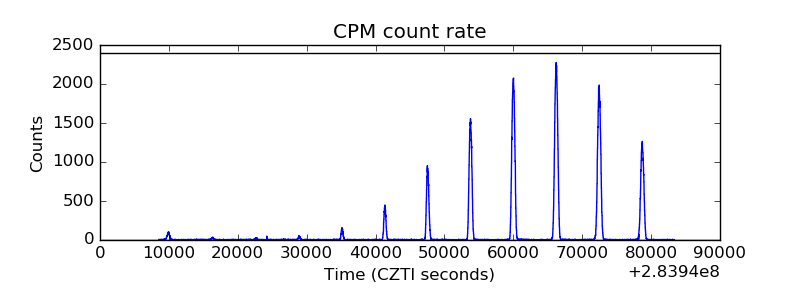 |
| CZT Counter | 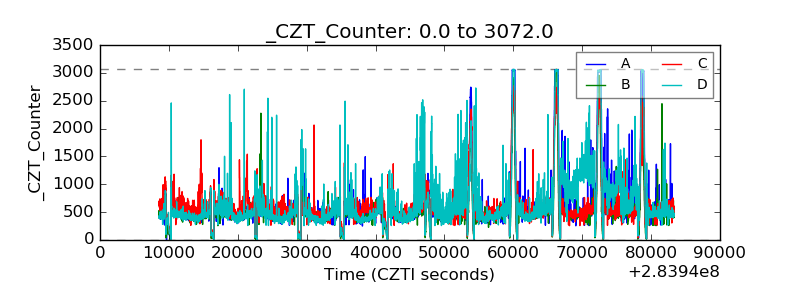 |
| +2.5 Volts monitor |  |
| +5 Volts monitor |  |
| _ROLL_ROT |  |
| _Roll_DEC |  |
| _Roll_RA | 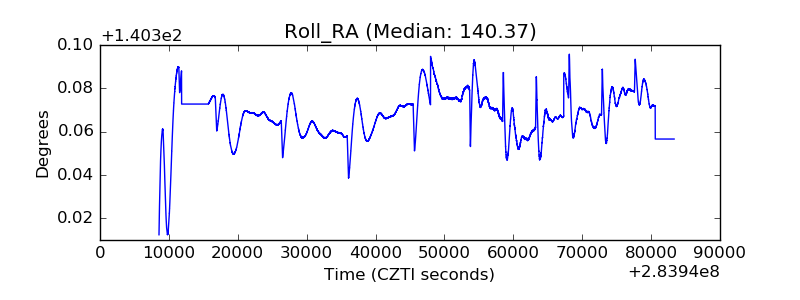 |
| Veto Counter |  |