| Param | Original file | Final file |
|---|---|---|
| Filename | modeM0/AS1T03_027T01_9000002608cztM0_level2_bc.evt | modeM0/AS1T03_027T01_9000002608cztM0_level2_quad_clean.evt |
| Size (bytes) | 1,159,574,400 | 450,025,920 |
| Size | 1.1 GB | 429.2 MB |
| Events in quadrant A | 6,842,531 | 2,921,347 |
| Events in quadrant B | 6,987,796 | 2,957,797 |
| Events in quadrant C | 11,349,415 | 2,809,722 |
| Events in quadrant D | 7,813,266 | 2,803,418 |
| Mode M0 | |||
|---|---|---|---|
| Quadrant | BADHDUFLAG | Total packets | Discarded packets |
| A | 0 | 65053 | 0 |
| B | 0 | 65790 | 0 |
| C | 0 | 87223 | 0 |
| D | 0 | 67779 | 0 |
| Mode SS | |||
|---|---|---|---|
| Quadrant | BADHDUFLAG | Total packets | Discarded packets |
| A | 0 | 632 | 0 |
| B | 0 | 632 | 0 |
| C | 0 | 632 | 0 |
| D | 0 | 632 | 0 |
| Mode M9 | |||
|---|---|---|---|
| Quadrant | BADHDUFLAG | Total packets | Discarded packets |
| A | 0 | 74 | 0 |
| B | 0 | 74 | 0 |
| C | 0 | 74 | 0 |
| D | 0 | 74 | 0 |
| Quadrant | Total seconds | Saturated seconds | Saturation percentage |
|---|---|---|---|
| A | 31138 | 372 | 1.194682% |
| B | 31138 | 457 | 1.467660% |
| C | 31138 | 731 | 2.347614% |
| D | 31138 | 328 | 1.053375% |
Noise dominated data is calculated using 1-second bins in cleaned event files. If a bin has >2000 counts, and if more than 50% of those come from <1% of pixels, then it is considered to be noise-dominated and hence unusable.
| Quadrant | # 1 sec bins | Bins with >0 counts | Bins with >2000 counts | High rate bins dominated by noise | Noise dominated (total time) | Noise dominated (detector-on time) | Marked lightcurve |
|---|---|---|---|---|---|---|---|
| A | 38373 | 31135 | 0 | 0 | 0.00% | 0.00% | 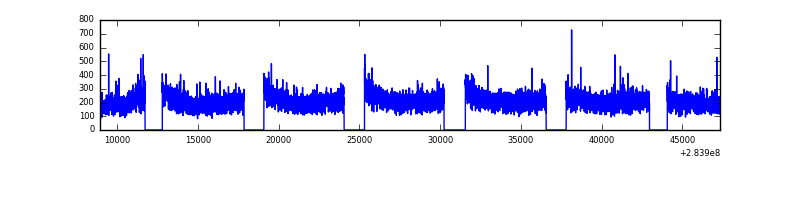 |
| B | 38373 | 31135 | 0 | 0 | 0.00% | 0.00% |  |
| C | 38373 | 31137 | 0 | 0 | 0.00% | 0.00% |  |
| D | 38373 | 31137 | 42 | 42 | 0.11% | 0.13% |  |
Top three noisy pixels from each quadrant. If the there are fewer than three noisy pixels in the level2.evt file, extra rows are filled as -1
| Pixel properties | Quadrant properties | ||||||
|---|---|---|---|---|---|---|---|
| Quadrant | DetID | PixID | Counts | Sigma | Mean | Median | Sigma |
| A | 13 | 210 | 48119 | 121.38 | 1767 | 1737 | 382.1 |
| A | 0 | 13 | 21014 | 50.45 | 1767 | 1737 | 382.1 |
| A | 15 | 174 | 11835 | 26.43 | 1767 | 1737 | 382.1 |
| B | 0 | 183 | 62619 | 184.97 | 1783 | 1742 | 329.1 |
| B | 0 | 189 | 35924 | 103.86 | 1783 | 1742 | 329.1 |
| B | 4 | 80 | 26363 | 74.81 | 1783 | 1742 | 329.1 |
| C | 3 | 233 | 4648863 | 11977.17 | 1681 | 1677 | 388.0 |
| C | 5 | 218 | 231917 | 593.4 | 1681 | 1677 | 388.0 |
| C | 13 | 61 | 9956 | 21.34 | 1681 | 1677 | 388.0 |
| D | 13 | 168 | 480607 | 1203.36 | 1737 | 1680 | 398.0 |
| D | 1 | 52 | 261798 | 653.57 | 1737 | 1680 | 398.0 |
| D | 13 | 232 | 120696 | 299.04 | 1737 | 1680 | 398.0 |
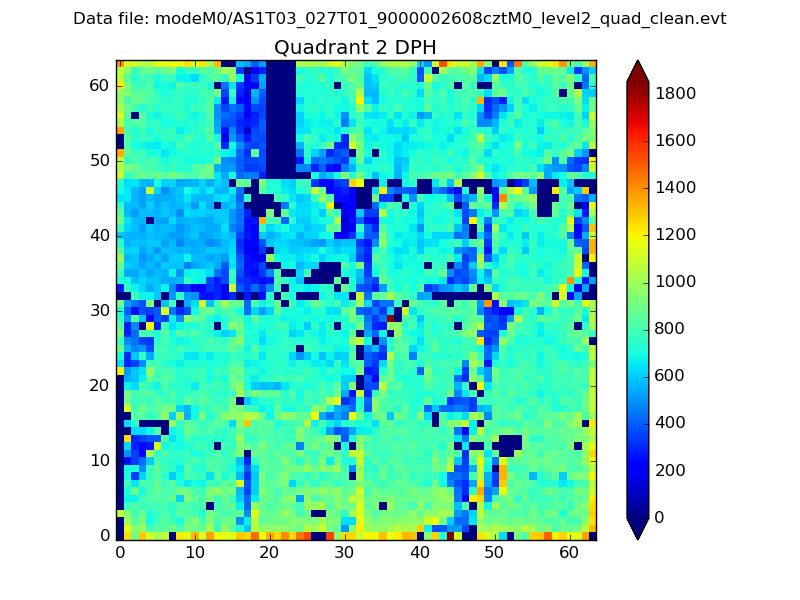
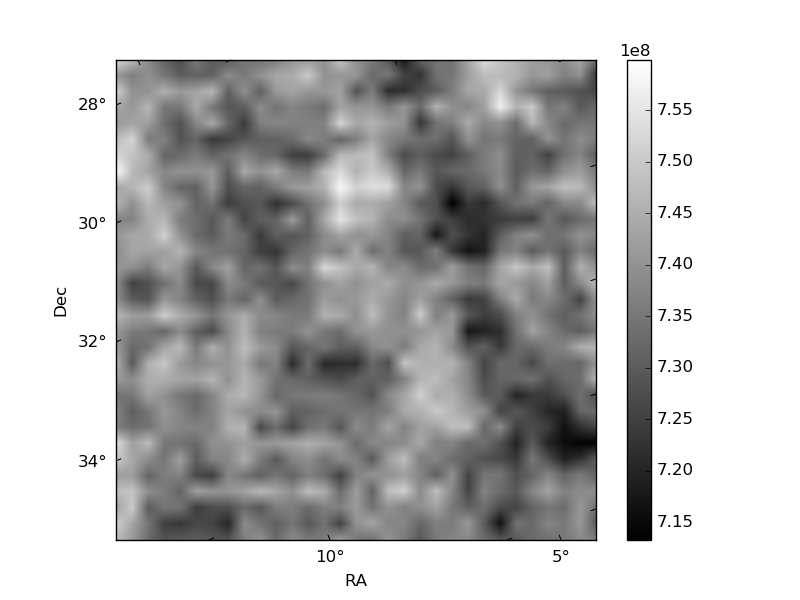
Histogram calculated using DETX and DETY for each event in the final _common_clean file
| Quadrant A |  |
 |
Quadrant B |
|---|---|---|---|
| Quadrant D | 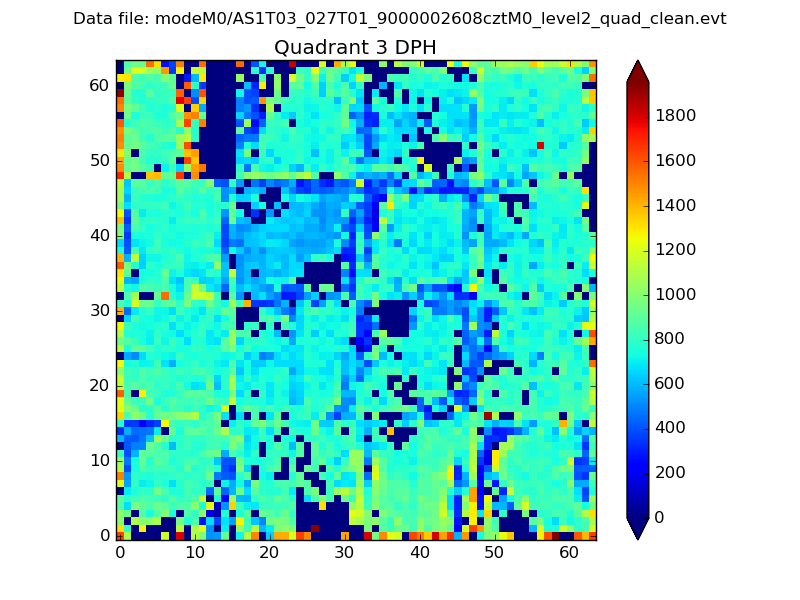 |
 |
Quadrant C |
| Plot type | Count rate plots | Images |
|---|---|---|
| Comparison with Poisson distribution Blue bars denote a histogram of data divided into 1 sec bins. Red curve is a Poisson curve with rate = median count rate of data. |
 |
 |
| Quadrant-wise count rates Data is divided into 100 sec bins |
 |
|
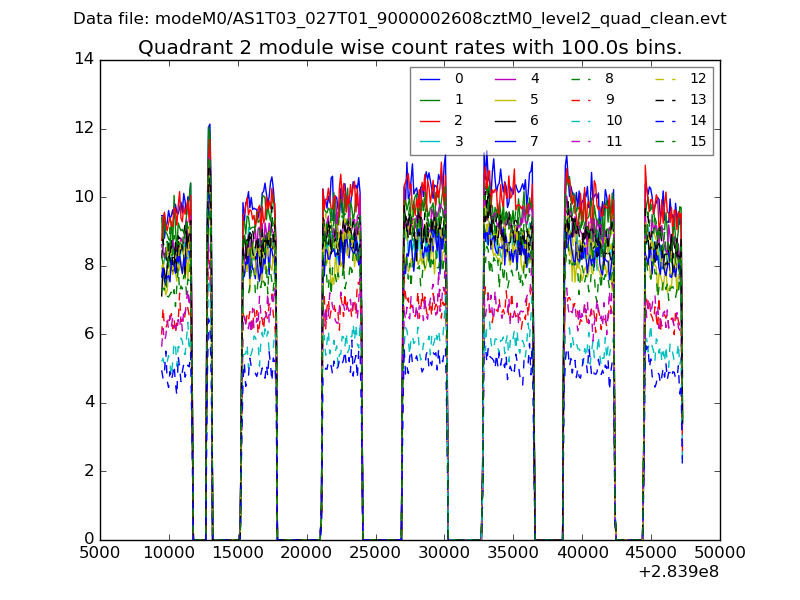
| Module-wise count rates for Quadrant A Data is divided into 100 sec bins |
 |
 |
| Module-wise count rates for Quadrant B Data is divided into 100 sec bins |
 |
 |
| Module-wise count rates for Quadrant C Data is divided into 100 sec bins |
 |
 |
| Module-wise count rates for Quadrant D Data is divided into 100 sec bins |
 |
 |
| Parameter | Plot |
|---|---|
| CZT HV Monitor |  |
| D_VDD |  |
| Temperature 1 |  |
| Veto HV Monitor | 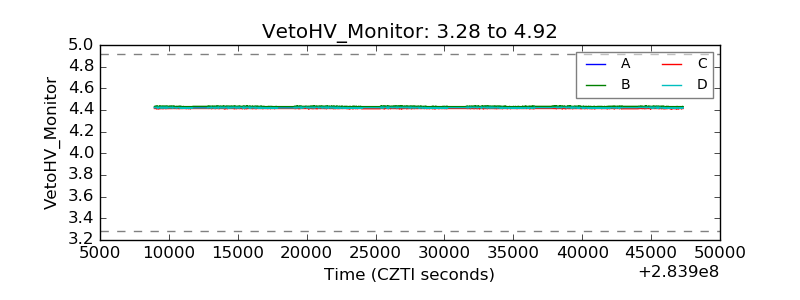 |
| Veto LLD |  |
| Alpha Counter |  |
| _CPM_Rate |  |
| CZT Counter |  |
| +2.5 Volts monitor |  |
| +5 Volts monitor |  |
| _ROLL_ROT |  |
| _Roll_DEC | 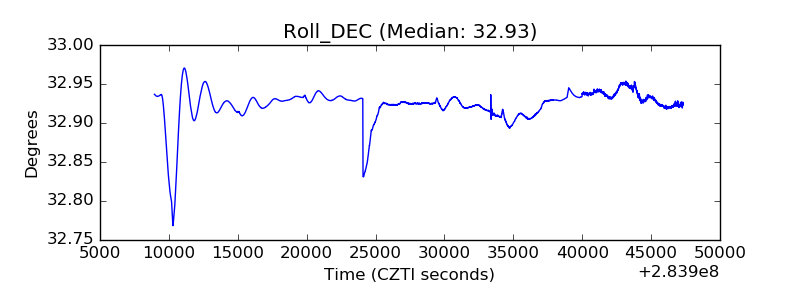 |
| _Roll_RA | 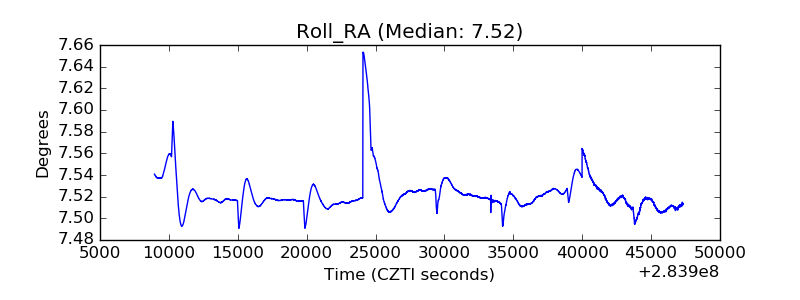 |
| Veto Counter |  |