| Param | Original file | Final file |
|---|---|---|
| Filename | modeM0/AS1T03_012T01_9000002606cztM0_level2_bc.evt | modeM0/AS1T03_012T01_9000002606cztM0_level2_quad_clean.evt |
| Size (bytes) | 624,660,480 | 239,230,080 |
| Size | 595.7 MB | 228.1 MB |
| Events in quadrant A | 3,659,744 | 1,515,007 |
| Events in quadrant B | 3,761,427 | 1,525,211 |
| Events in quadrant C | 6,084,012 | 1,455,570 |
| Events in quadrant D | 4,130,481 | 1,460,247 |
| Mode SS | |||
|---|---|---|---|
| Quadrant | BADHDUFLAG | Total packets | Discarded packets |
| A | 0 | 384 | 0 |
| B | 0 | 384 | 0 |
| C | 0 | 384 | 0 |
| D | 0 | 384 | 0 |
| Mode M0 | |||
|---|---|---|---|
| Quadrant | BADHDUFLAG | Total packets | Discarded packets |
| A | 0 | 38261 | 0 |
| B | 0 | 38649 | 0 |
| C | 0 | 49593 | 0 |
| D | 0 | 40112 | 0 |
| Mode M9 | |||
|---|---|---|---|
| Quadrant | BADHDUFLAG | Total packets | Discarded packets |
| A | 0 | 29 | 0 |
| B | 0 | 29 | 0 |
| C | 0 | 29 | 0 |
| D | 0 | 29 | 0 |
| Quadrant | Total seconds | Saturated seconds | Saturation percentage |
|---|---|---|---|
| A | 18716 | 86 | 0.459500% |
| B | 18716 | 126 | 0.673221% |
| C | 18716 | 335 | 1.789912% |
| D | 18716 | 166 | 0.886942% |
Noise dominated data is calculated using 1-second bins in cleaned event files. If a bin has >2000 counts, and if more than 50% of those come from <1% of pixels, then it is considered to be noise-dominated and hence unusable.
| Quadrant | # 1 sec bins | Bins with >0 counts | Bins with >2000 counts | High rate bins dominated by noise | Noise dominated (total time) | Noise dominated (detector-on time) | Marked lightcurve |
|---|---|---|---|---|---|---|---|
| A | 21631 | 18718 | 1 | 1 | 0.00% | 0.01% | 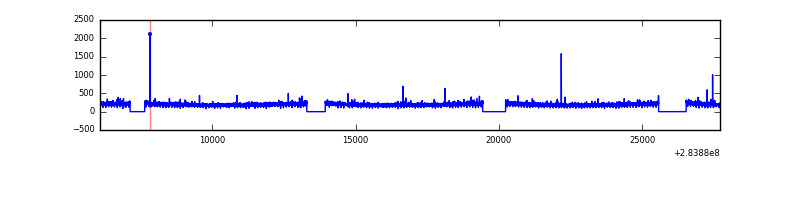 |
| B | 21631 | 18716 | 0 | 0 | 0.00% | 0.00% |  |
| C | 21631 | 18715 | 0 | 0 | 0.00% | 0.00% |  |
| D | 21631 | 18716 | 7 | 7 | 0.03% | 0.04% | 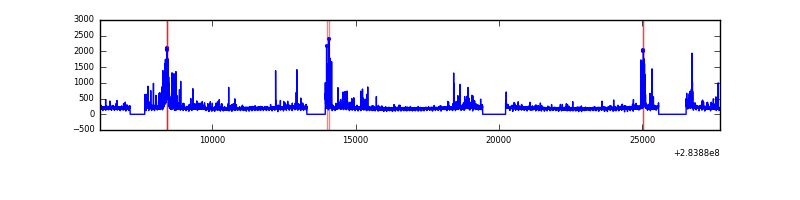 |
Top three noisy pixels from each quadrant. If the there are fewer than three noisy pixels in the level2.evt file, extra rows are filled as -1
| Pixel properties | Quadrant properties | ||||||
|---|---|---|---|---|---|---|---|
| Quadrant | DetID | PixID | Counts | Sigma | Mean | Median | Sigma |
| A | 0 | 13 | 26363 | 120.79 | 942 | 922 | 210.6 |
| A | 14 | 237 | 8180 | 34.46 | 942 | 922 | 210.6 |
| A | 15 | 191 | 7939 | 33.31 | 942 | 922 | 210.6 |
| B | 0 | 189 | 35090 | 185.95 | 946 | 921 | 183.8 |
| B | 0 | 230 | 27734 | 145.92 | 946 | 921 | 183.8 |
| B | 0 | 183 | 17471 | 90.07 | 946 | 921 | 183.8 |
| C | 3 | 233 | 2486057 | 11625.99 | 898 | 890 | 213.8 |
| C | 5 | 218 | 126837 | 589.2 | 898 | 890 | 213.8 |
| C | 9 | 54 | 9941 | 42.34 | 898 | 890 | 213.8 |
| D | 13 | 189 | 299242 | 1381.25 | 927 | 895 | 216.0 |
| D | 7 | 55 | 109776 | 504.08 | 927 | 895 | 216.0 |
| D | 2 | 234 | 65390 | 298.59 | 927 | 895 | 216.0 |
Histogram calculated using DETX and DETY for each event in the final _common_clean file
| Quadrant A | 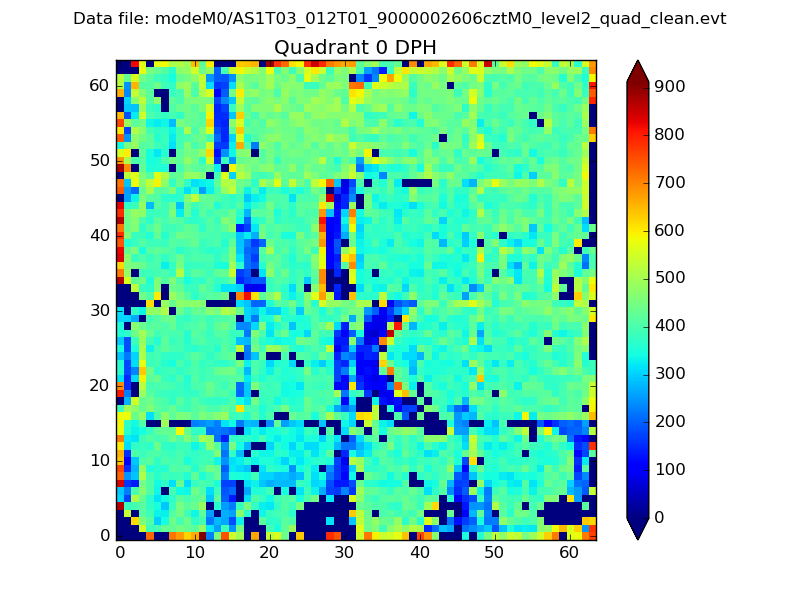 |
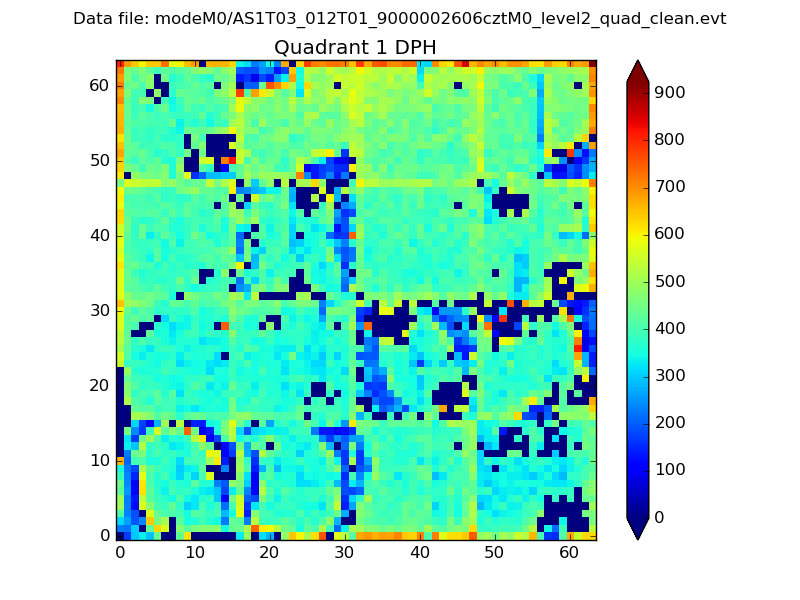 |
Quadrant B |
|---|---|---|---|
| Quadrant D | 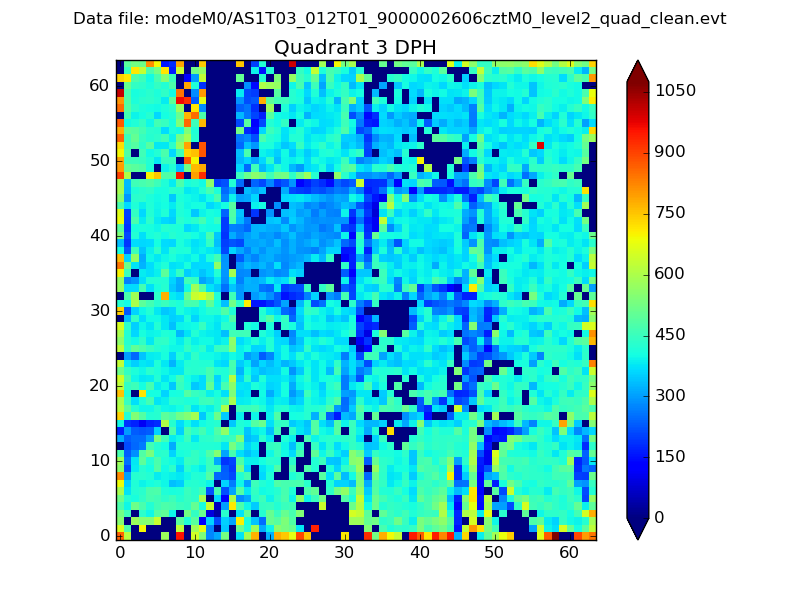 |
 |
Quadrant C |
| Plot type | Count rate plots | Images |
|---|---|---|
| Comparison with Poisson distribution Blue bars denote a histogram of data divided into 1 sec bins. Red curve is a Poisson curve with rate = median count rate of data. |
 |
 |
| Quadrant-wise count rates Data is divided into 100 sec bins |
 |
|
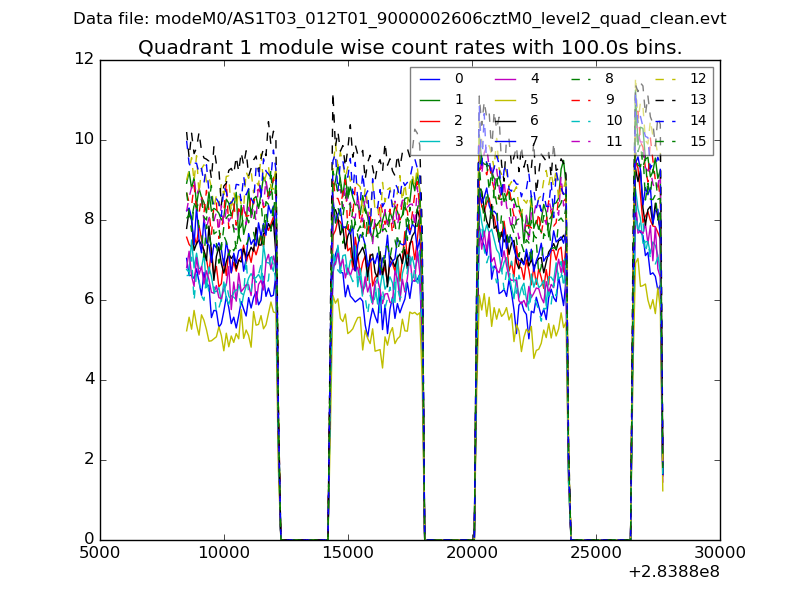
| Module-wise count rates for Quadrant A Data is divided into 100 sec bins |
 |
 |
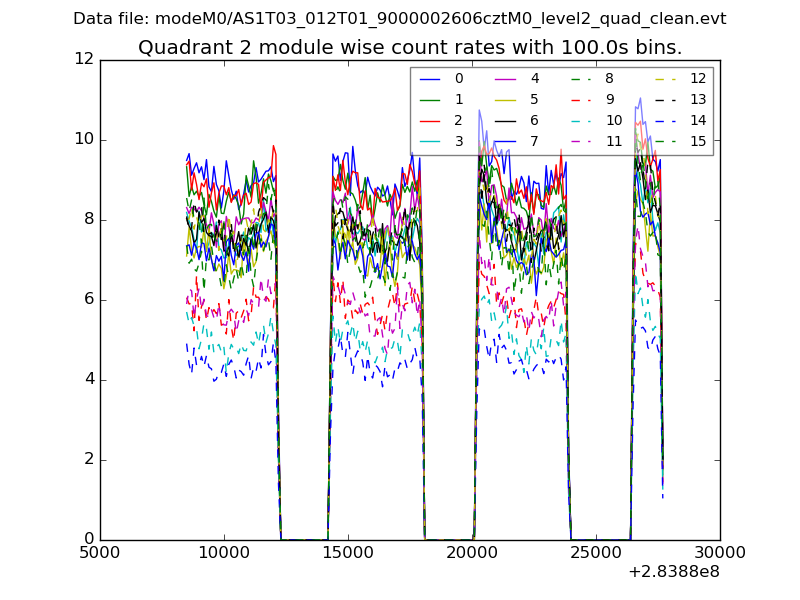
| Module-wise count rates for Quadrant B Data is divided into 100 sec bins |
 |
 |
| Module-wise count rates for Quadrant C Data is divided into 100 sec bins |
 |
 |
| Module-wise count rates for Quadrant D Data is divided into 100 sec bins |
 |
 |
| Parameter | Plot |
|---|---|
| CZT HV Monitor | 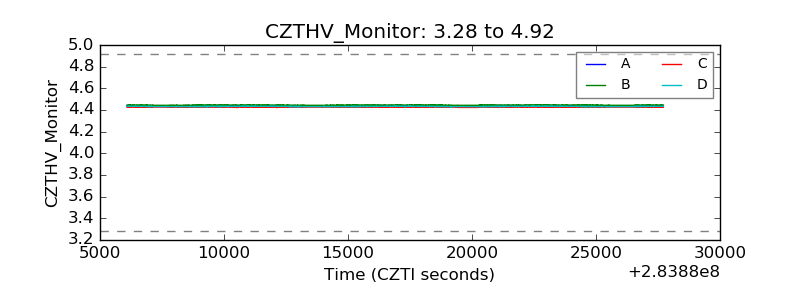 |
| D_VDD |  |
| Temperature 1 |  |
| Veto HV Monitor |  |
| Veto LLD |  |
| Alpha Counter |  |
| _CPM_Rate | 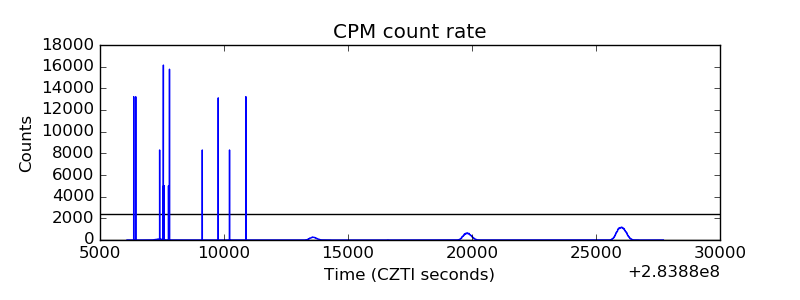 |
| CZT Counter |  |
| +2.5 Volts monitor |  |
| +5 Volts monitor |  |
| _ROLL_ROT |  |
| _Roll_DEC |  |
| _Roll_RA |  |
| Veto Counter |  |